JISAO data

Puerto Chicama Perú (8°S) SST (C)
Analyses | Data (totals, anomalies)

Data provided by Pablo Lagos of the Instituto Geofísico del Perú (IGP) ( plagos@geo.igp.gob.pe ).

The IGP WWW site offers real-time weekly mean SST analyses (maps) for the Ecuador and Peru coasts. Beneath the "Temperatura del mar observada" heading, click on the "Temperatura superficial del mar" link.


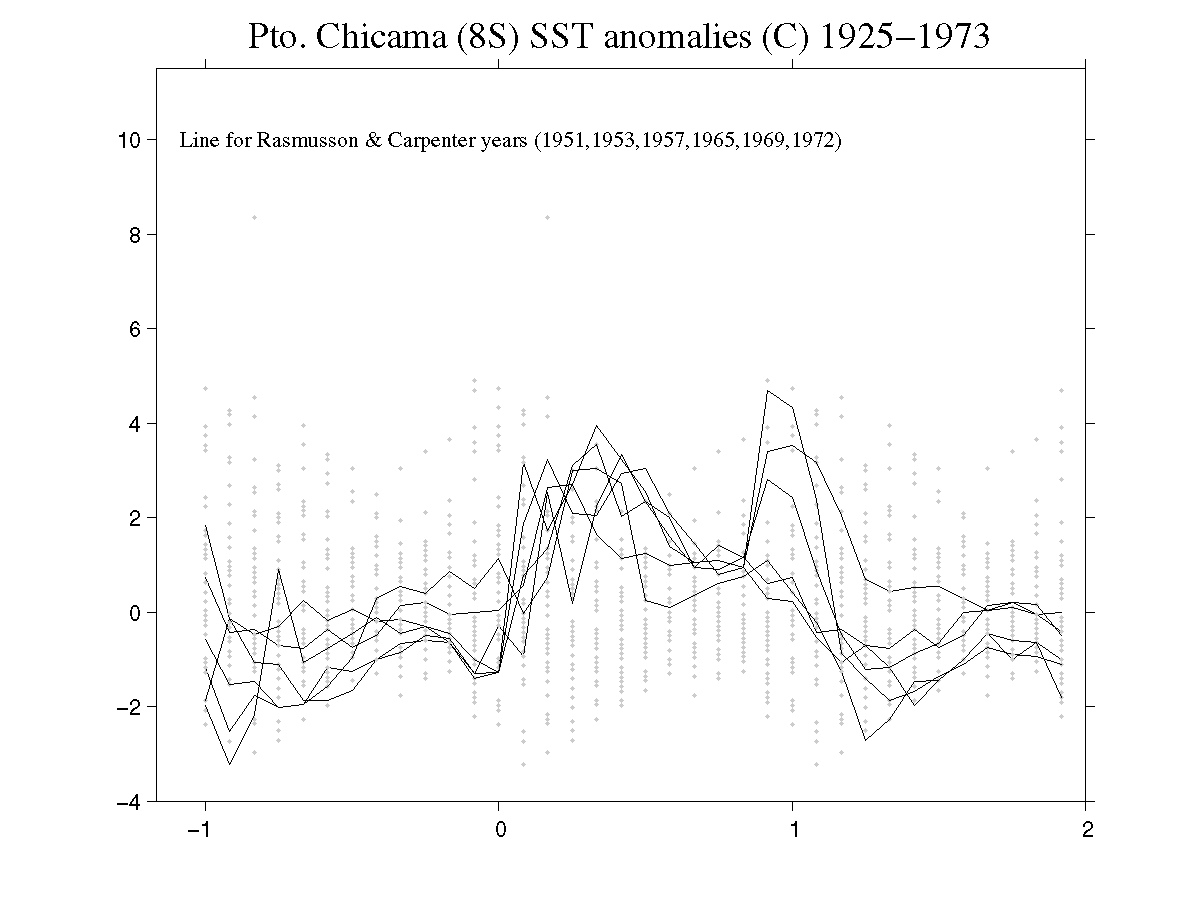
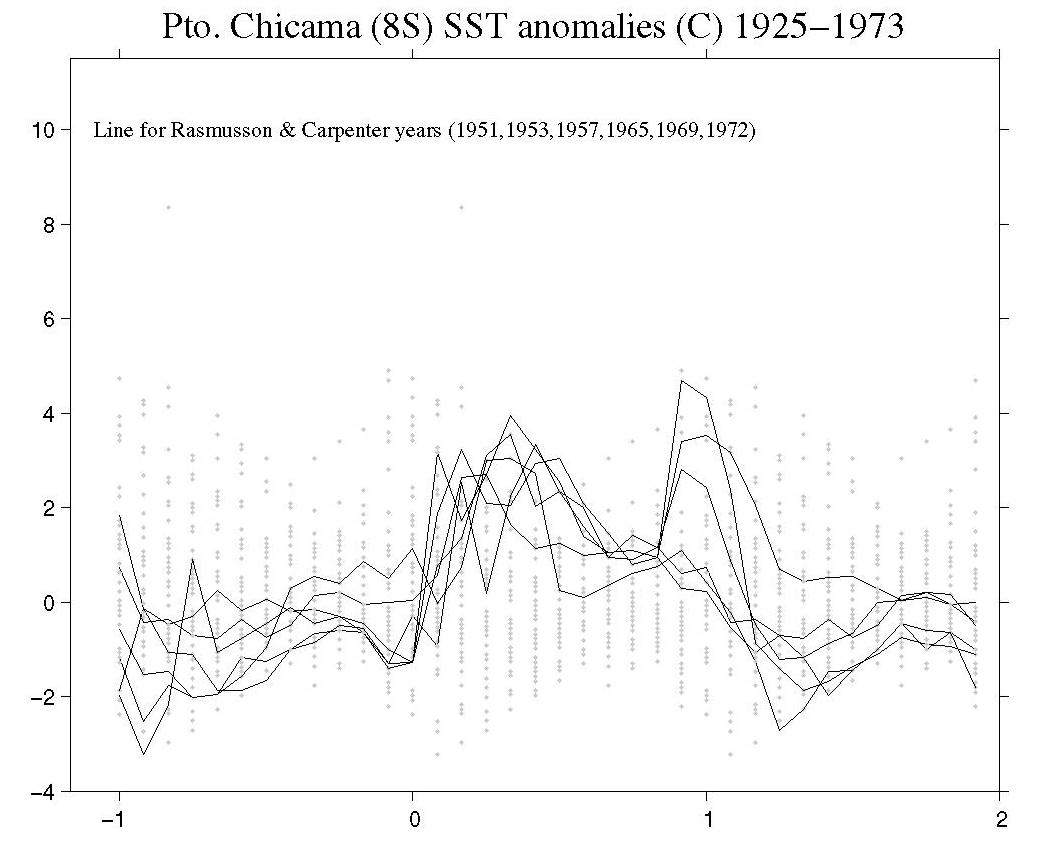
Historical SST anomalies (C) for 1925-Nov98
Image shows 1982-83 and 1997-98 warm events dominating the variability.  Also 
notable is decadal variability of the beginning of the series with 
warm (cool) anomalies in 1925-30 and 1939-45 (1933-38) ---- is this real?
Anomalies are with respect to 1950-79. The series is smoothed with successive 9- and 7-point running means.

Recent SST anomalies: 1980-Feb99 (C)
Image shows 1982-83 and 1997-98 
warm episodes, and several minor temporally-coherent fluctuations.
Anomalies are with respect to 1985-94.

Recent (1980-Feb99) SST and 1985-94 climatology (C)
Image shows 1982-83, 1987-83, 
1991, 1991-92, and 1993 warm episodes as amplifications of the 
climatological warm season.  1997-98 exhibits two clear peaks in SST.
This analysis is in the spirit of a similar analysis in Wyrtki (1975, J. Phys. Oceanogr., 5, 572-584).

See caption
PostScript | Big Gif | PNG | JPEG

Time series plot of Pto. Chicama SST anomalies for 1925-73. The Rasmusson and Carpenter (RC) El Niño years (1951,1953,1957,1965,1969,1972) are drawn as lines. The RC years are characterized by a quick onset of positive anomalies in January-February-March, with anomaly magnitude diminishing during September-October-November, the local cold season, and oftentimes large anomalies in November-December and the following January.

See caption
PostScript | Big Gif | PNG | JPEG
Same as above, but including data through 1999. The red, green, and blue lines are SSTs in 1925; 1983; and 1997 and 1998, respectively. The 1982-83 and 1997-98 events were of much larger magnitude than the the earlier El Niños in the reocord, but the largest anomalies remain centered in December-January-February.


Data:

The time series as:
a 3-column table: year, month, value (C)
a 1-column table: value (C)


               Digital values in 0.1 degrees C.
       jan  feb  mar  apr  may  jun  jul  aug  sep  oct  nov  dec
 1925  183  208  268  197  197  191  190  187  177  175  175  211
 1926  216  227  186  170  168  167  173  170  164  166  171  165
 1927  175  199  198  182  180  179  177  174  172  167  173  181
 1928  182  195  189  180  180  172  169  170  170  169  167  173
 1929  182  208  226  184  204  183  176  177  169  169  173  177
 1930  181  194  206  203  196  181  180  183  188  188  191  198
 1931  206  208  194  175  161  160  163  158  149  149  146  147
 1932  177  218  186  193  195  183  162  157  150  150  153  154
 1933  157  182  173  175  158  157  157  158  144  144  146  144
 1934  145  171  176  163  159  174  174  160  146  146  142  140
 1935  150  158  155  152  167  156  157  152  146  146  152  159
 1936  159  179  188  186  174  154  152  154  150  150  149  143
 1937  148  201  161  161  162  166  163  157  148  141  151  155
 1938  159  170  174  154  151  154  152  149  140  140  144  145
 1939  185  188  191  183  179  179  169  164  162  155  156  169
 1940  186  193  196  183  184  182  174  165  161  168  178  201
 1941  216  225  230  207  209  175  164  164  165  169  175  177
 1942  203  196  177  172  170  168  157  157  155  154  151  151
 1943  208  228  196  174  174  185  180  171  158  154  152  160
 1944  167  177  193  192  183  175  178  172  162  158  156  158
 1945  166  212  179  168  164  168  179  165  160  154  152  156
 1946  164  183  176  174  167  163  160  160  160  155  158  174
 1947  191  187  180  173  169  163  161  158  154  153  151  155
 1948  177  208  198  196  189  185  180  171  167  162  160  161
 1949  168  212  202  181  175  173  167  164  162  158  162  155
 1950  157  160  167  157  154  158  154  152  149  149  149  149
 1951  166  176  210  179  196  203  190  178  167  168  166  168
 1952  176  181  181  170  166  166  159  157  159  156  154  162
 1953  169  191  211  204  190  181  179  172  168  165  164  165
 1954  171  180  174  170  162  150  152  152  153  144  148  152
 1955  166  182  177  171  162  158  158  154  150  144  144  148
 1956  150  184  180  174  176  168  167  160  156  151  148  149
 1957  156  217  202  204  213  202  192  176  168  165  164  196
 1958  204  217  205  184  178  175  172  165  158  155  154  158
 1959  164  201  197  188  180  169  161  160  156  152  156  166
 1960  173  182  178  168  164  162  160  160  156  154  154  158
 1961  177  188  177  172  174  164  163  156  156  150  150  151
 1962  175  176  162  159  162  161  160  158  156  152  152  154
 1963  158  185  186  166  178  170  170  167  164  159  158  172
 1964  187  184  174  166  155  151  150  152  151  148  148  148
 1965  156  193  198  208  209  190  190  182  167  163  166  190
 1966  193  194  180  165  162  161  160  162  158  156  156  157
 1967  157  174  184  168  163  167  165  158  153  148  147  151
 1968  163  170  170  157  154  154  157  165  163  158  163  167
 1969  180  185  192  207  204  197  169  163  161  160  162  173
 1970  173  183  172  150  151  155  152  152  153  148  148  144
 1971  149  153  163  186  163  162  162  161  153  151  150  152
 1972  156  204  217  198  194  199  197  183  172  162  164  209
 1973  212  209  176  163  155  153  153  151  150  145  145  151
 1974  158  162  172  176  178  176  170  155  149  145  144  143
 1975  146  171  184  185  167  157  154  153  146  142  141  144
 1976  146  210  184  182  190  193  190  179  167  165  164  190
 1977  182  181  186  180  169  168  168  160  155  151  155  173
 1978  171  186  185  175  162  159  159  153  149  147  153  154
 1979  170  178  194  179  176  162  162  164  163  165  166  166
 1980  182  188  186  182  170  165  162  159  156  157  159  159
 1981  160  166  173  166  165  164  159  156  157  162  155  157
 1982  169  176  175  174  174  173  173  161  159  180  208  230
 1983  247  254  247  266  271  265  203  177  170  169  162  159
 1984  162  163  167  174  162  158  157  155  152  152  153  153
 1985  158  157  171  157  156  154  158  157  153  153  153  157
 1986  171  175  172  161  165  166  166  170  159  152  170  179
 1987  177  216  225  204  190  182  176  168  163  165  168  168
 1988  173  176  171  167  159  153  150  151  150  151  151  151
 1989  153  179  180  173  153  152  154  151  151  152  153  156
 1990  155  180  192  176  174  170  162  152  159  156  151  159
 1991  195  199  202  179  166  177  172  169  156  158  167  200
 1992  203  229  235  218  209  210  193  170  159  156  158  158
 1993  172  212  199  186  185  183  182  173  163  160  161  156
 1994  160  175                      164  165  152  159  166  181
 1995  189  192  182  174  166  159  161  159  158  154  155  153
 1996  155  169  184  166  158  159  156  155  154  150  153  167
 1997  156  167  203  195  209  224  223  219  199  197  228  252
 1998  262  272  258  222  214  176  168  166  161  155  155  156
 1999  154  178  172  164  162  160  162  159  154  148  152  153
 2000  152  173  169  175  170  171  168  162  155  154  153  154
 2001  154  168  202  177  167  167  161  155  151  146  150  154
 2002  162  187  213  185  168  161  158  159                    


                   Anomalies (in 0.01C) with respect to 1950-79
       jan  feb  mar  apr  may  jun  jul  aug  sep  oct  nov  dec
 1925  143  228  834  200  234  213  235  250  195  211  206  490
 1926  473  418   14  -70  -56  -27   65   80   65  121  166   30
 1927   63  138  134   50   64   93  105  120  145  131  186  190
 1928  133   98   44   30   64   23   25   80  125  151  126  110
 1929  133  228  414   70  304  133   95  150  115  151  186  150
 1930  123   88  214  260  224  113  135  210  305  341  366  360
 1931  373  228   94  -20 -126  -97  -35  -40  -85  -49  -84 -150
 1932   83  328   14  160  214  133  -45  -50  -75  -39  -14  -80
 1933 -117  -32 -116  -20 -156 -127  -95  -40 -135  -99  -84 -180
 1934 -237 -142  -86 -140 -146   43   75  -20 -115  -79 -124 -220
 1935 -187 -272 -296 -250  -66 -137  -95 -100 -115  -79  -24  -30
 1936  -97  -62   34   90    4 -157 -145  -80  -75  -39  -54 -190
 1937 -207  158 -236 -160 -116  -37  -35  -50  -95 -129  -34  -70
 1938  -97 -152 -106 -230 -226 -157 -145 -130 -175 -139 -104 -170
 1939  163   28   64   60   54   93   25   20   45   11   16   70
 1940  173   78  114   60  104  123   75   30   35  141  236  390
 1941  473  398  454  300  354   53  -25   20   75  151  206  150
 1942  343  108  -76  -50  -36  -17  -95  -50  -25    1  -34 -110
 1943  393  428  114  -30    4  153  135   90    5    1  -24  -20
 1944  -17  -82   84  150   94   53  115  100   45   41   16  -40
 1945  -27  268  -56  -90  -96  -17  125   30   25    1  -24  -60
 1946  -47  -22  -86  -30  -66  -67  -65  -20   25   11   36  120
 1947  223   18  -46  -40  -46  -67  -55  -40  -35   -9  -34  -70
 1948   83  228  134  190  154  153  135   90   95   81   56  -10
 1949   -7  268  174   40   14   33    5   20   45   41   76  -70
 1950 -117 -252 -176 -200 -196 -117 -125 -100  -85  -49  -54 -130
 1951  -27  -92  254   20  224  333  235  160   95  141  116   60
 1952   73  -42  -36  -70  -76  -37  -75  -50   15   21   -4    0
 1953    3   58  264  270  164  113  125  100  105  111   96   30
 1954   23  -52 -106  -70 -116 -197 -145 -100  -45  -99  -64 -100
 1955  -27  -32  -76  -60 -116 -117  -85  -80  -75  -99 -104 -140
 1956 -187  -12  -46  -30   24  -17    5  -20  -15  -29  -64 -130
 1957 -127  318  174  270  394  323  255  140  105  111   96  340
 1958  353  318  204   70   44   53   55   30    5   11   -4  -40
 1959  -47  158  124  110   64   -7  -55  -20  -15  -19   16   40
 1960   43  -32  -66  -90  -96  -77  -65  -20  -15    1   -4  -40
 1961   83   28  -76  -50    4  -57  -35  -60  -15  -39  -44 -110
 1962   63  -92 -226 -180 -116  -87  -65  -40  -15  -19  -24  -80
 1963 -107   -2   14 -110   44    3   35   50   65   51   36  100
 1964  183  -12 -106 -110 -186 -187 -165 -100  -65  -59  -64 -140
 1965 -127   78  134  310  354  203  235  200   95   91  116  280
 1966  243   88  -46 -120 -116  -87  -65    0    5   21   16  -50
 1967 -117 -112   -6  -90 -106  -27  -15  -40  -45  -59  -74 -110
 1968  -57 -152 -146 -200 -196 -157  -95   30   55   41   86   50
 1969  113   -2   74  300  304  273   25   10   35   61   76  110
 1970   43  -22 -126 -270 -226 -147 -145 -100  -45  -59  -64 -180
 1971 -197 -322 -216   90 -106  -77  -45  -10  -45  -29  -44 -100
 1972 -127  188  324  210  204  293  305  210  145   81   96  470
 1973  433  238  -86 -140 -186 -167 -135 -110  -75  -89  -94 -110
 1974 -107 -232 -126  -10   44   63   35  -70  -85  -89 -104 -190
 1975 -227 -142   -6   80  -66 -127 -125  -90 -115 -119 -134 -180
 1976 -227  248   -6   50  164  233  235  170   95  111   96  280
 1977  133  -42   14   30  -46  -17   15  -20  -25  -29    6  110
 1978   23    8    4  -20 -116 -107  -75  -90  -85  -69  -14  -80
 1979   13  -72   94   20   24  -77  -45   20   55  111  116   40
 1980  133   28   14   50  -36  -47  -45  -30  -15   31   46  -30
 1981  -87 -192 -116 -110  -86  -57  -75  -60   -5   81    6  -50
 1982    3  -92  -96  -30    4   33   65  -10   15  261  536  680
 1983  783  688  624  890  974  953  365  150  125  151   76  -30
 1984  -67 -222 -176  -30 -116 -117  -95  -70  -55  -19  -14  -90
 1985 -107 -282 -136 -200 -176 -157  -85  -50  -45   -9  -14  -50
 1986   23 -102 -126 -160  -86  -37   -5   80   15  -19  156  170
 1987   83  308  404  270  164  123   95   60   55  111  136   60
 1988   43  -92 -136 -100 -146 -167 -165 -110  -75  -29  -34 -110
 1989 -157  -62  -46  -40 -206 -177 -125 -110  -65  -19  -14  -60
 1990 -137  -52   74  -10    4    3  -45 -100   15   21  -34  -30
 1991  263  138  174   20  -76   73   55   70  -15   41  126  380
 1992  343  438  504  410  354  403  265   80   15   21   36  -40
 1993   33  268  144   90  114  133  155  110   55   61   66  -60
 1994  -87 -102                      -25   30  -55   51  116  190
 1995  203   68  -26  -30  -76 -107  -55  -30    5    1    6  -90
 1996 -137 -162   -6 -110 -156 -107 -105  -70  -35  -39  -14   50
 1997 -127 -182  184  180  354  543  565  570  415  431  736  900
 1998  933  868  734  450  404   63   15   40   35   11    6  -60
 1999 -147  -72 -126 -130 -116  -97  -45  -30  -35  -59  -24  -90
 2000 -167 -122 -156  -20  -36   13   15    0  -25    1  -14  -80
 2001 -147 -172  174    0  -66  -27  -55  -70  -65  -79  -44  -80
 2002  -67   18  284   80  -56  -87  -85  -30                    


                      1950-79 climatology (0.01C)
       jan  feb  mar  apr  may  jun  jul  aug  sep  oct  nov  dec
      1687 1852 1846 1770 1736 1697 1665 1620 1575 1539 1544 1620


January 2004
Todd Mitchell
(mitchell@atmos.washington.edu)
JISAO data