JISAO data


NCDC ERSST - GHCN merged land air and sea surface temperature anomalies

Data | ENSO analyses | Documentation and References


Typical ENSO temperature anomalies for all calendar months combined
global domain
big GIF | PDF | PNG | PS

The same analysis for just November through April (Northern Hemisphere extratropics cold season)
global domain
big GIF | PDF | PNG | PS

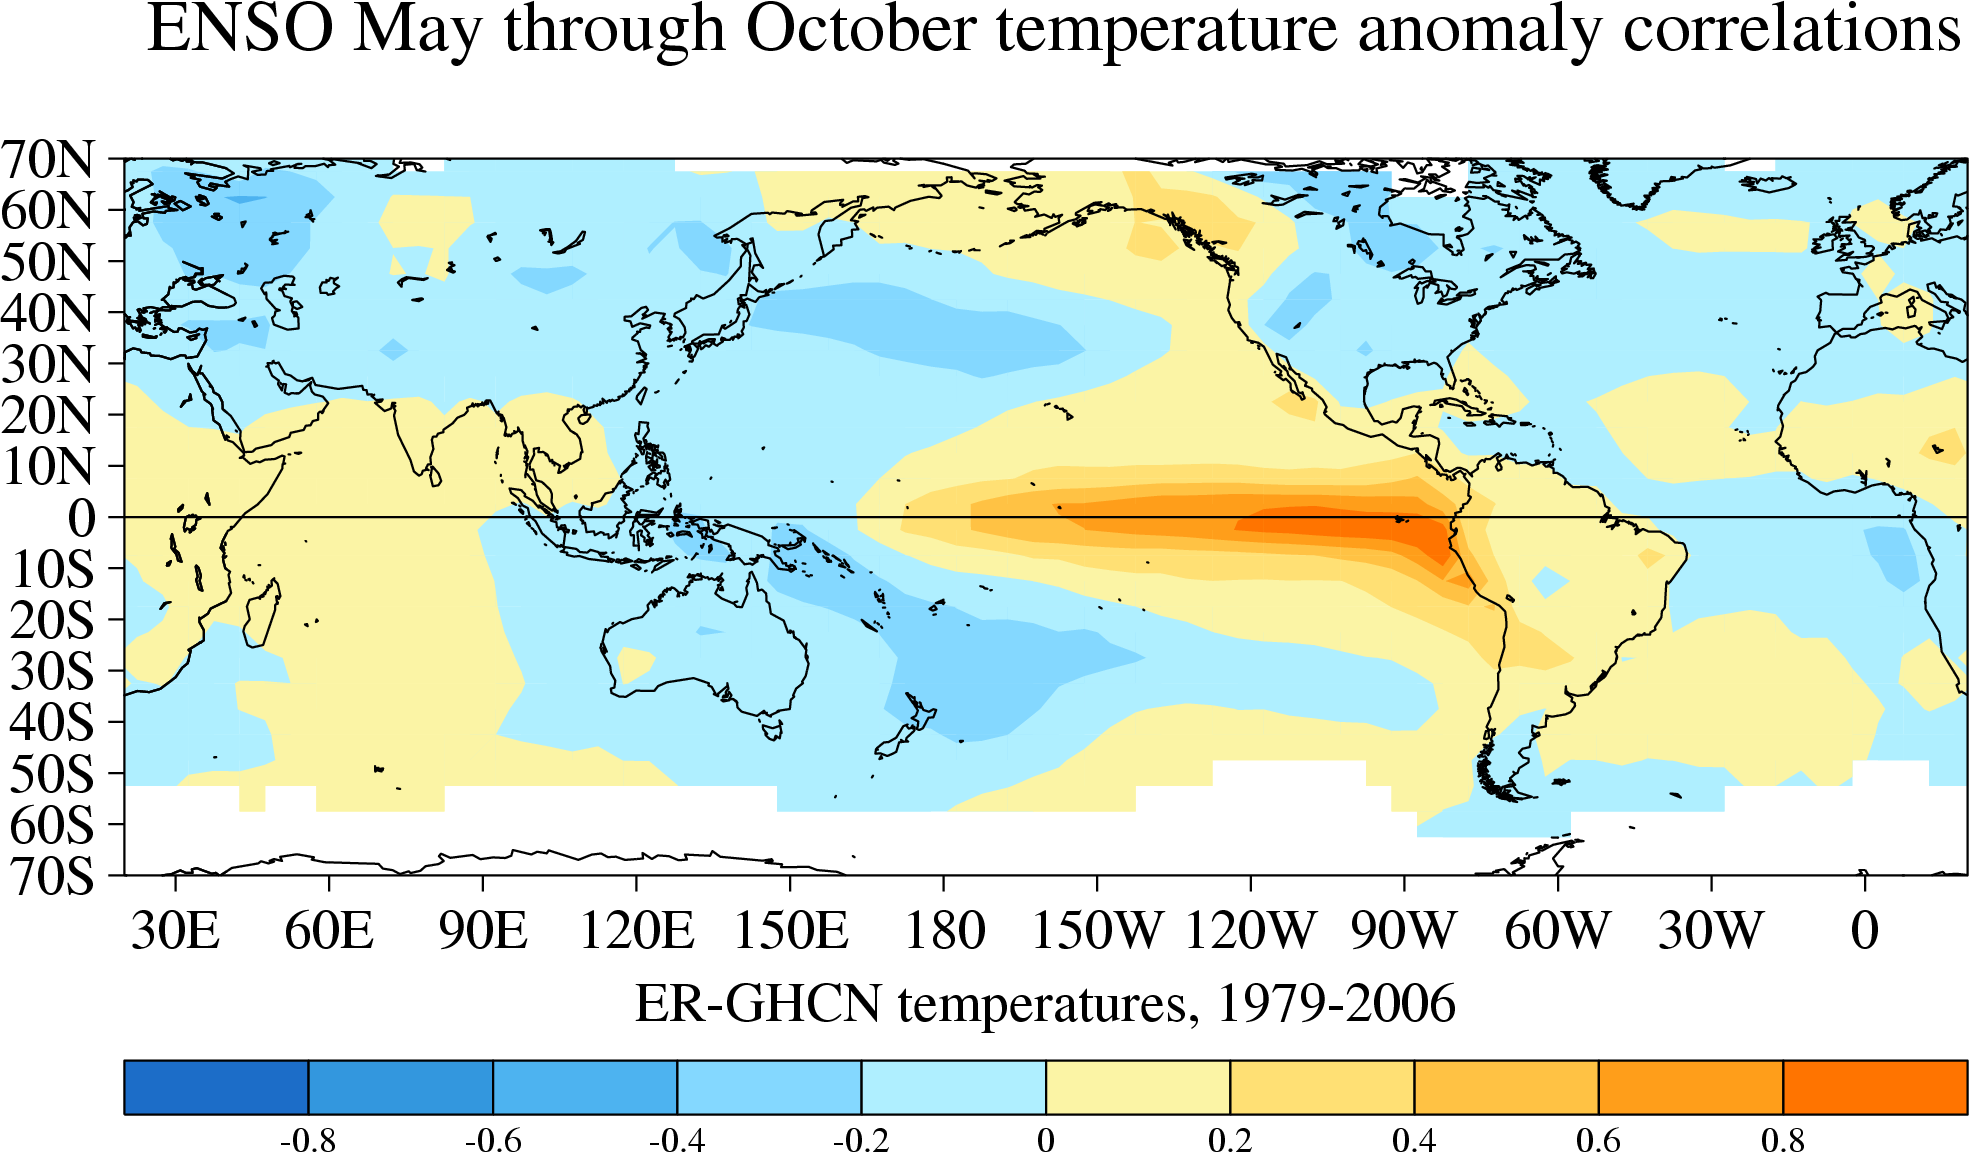
The same analysis for just May through October (Northern Hemisphere extratropics warm season)
global domain
big GIF | PDF | PNG | PS

There is a netCDF file of correlation and regression maps so that you can make figures for your domain.
map 1: temperature correlation with ENSO index (cold tongue index (CTI), similar to Nino 3.4 SST), all calendar months combined
map 2: temperature regressed onto standard CTI (C), all calendar months combined
maps 3 and 4: as in 1 and 2, but for November through April months
maps 5 and 6: as in 1 and 2, but for May through October months.
A PDF file with all of the correlation and regression analyses is linked here. The analysis years were chosen to complement the ENSO analysis with the GPCP precipitation data.


Data:
  • ASCII at NOAA NCDC. Up to date (it's their dataset).
  • NetCDF at the Earth System Research Laboratory. May or may not be up to date.
    At JISAO:
  • /home/disk/margaret/data/gridded_land_and_ocean_temp/er-ghcn-sst.nc
  • NetCDF, 1880 through April 2010 Updated as needed. All errors are due to Todd Mitchell.


    May 2010
    Todd Mitchell ( mitchell@atmos.washington.edu )
    JISAO data