Big GIF | JPG | PDF | PS
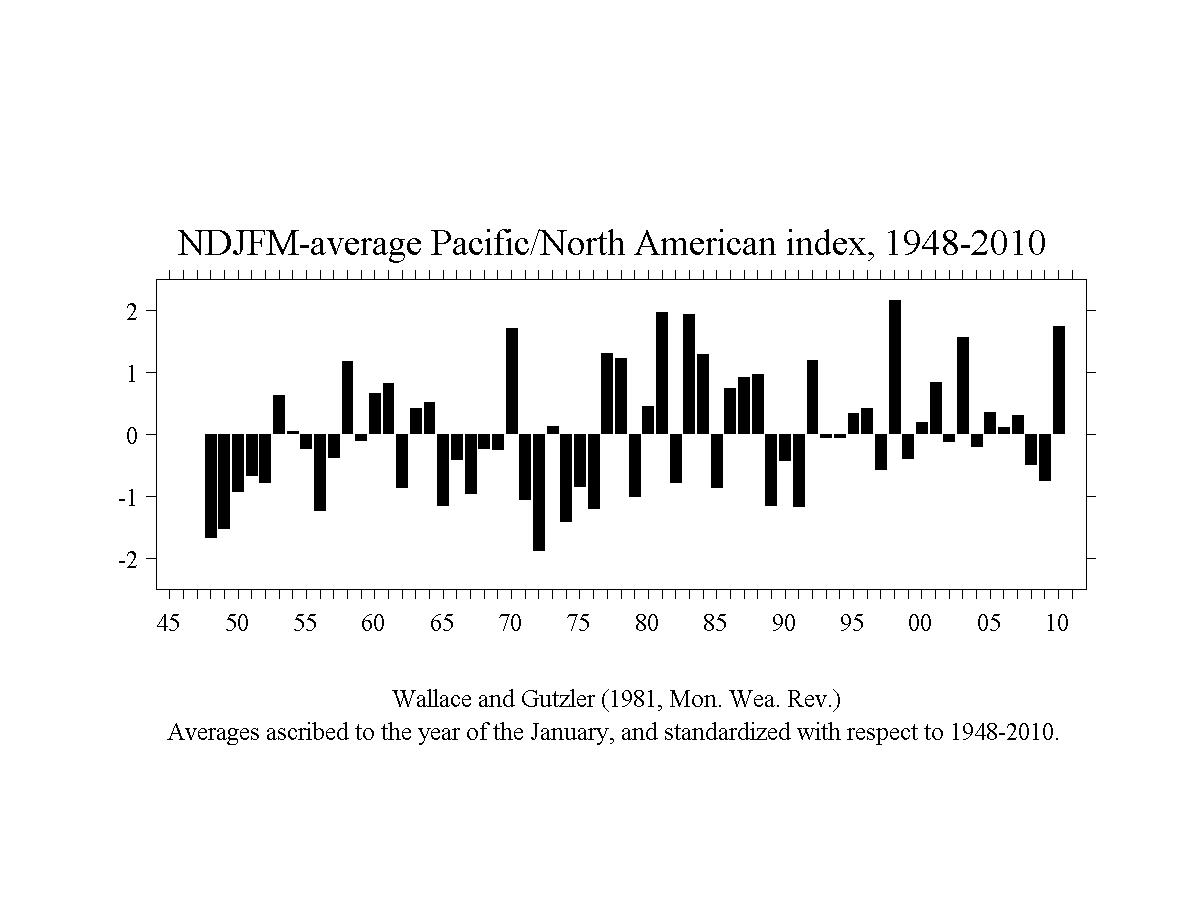
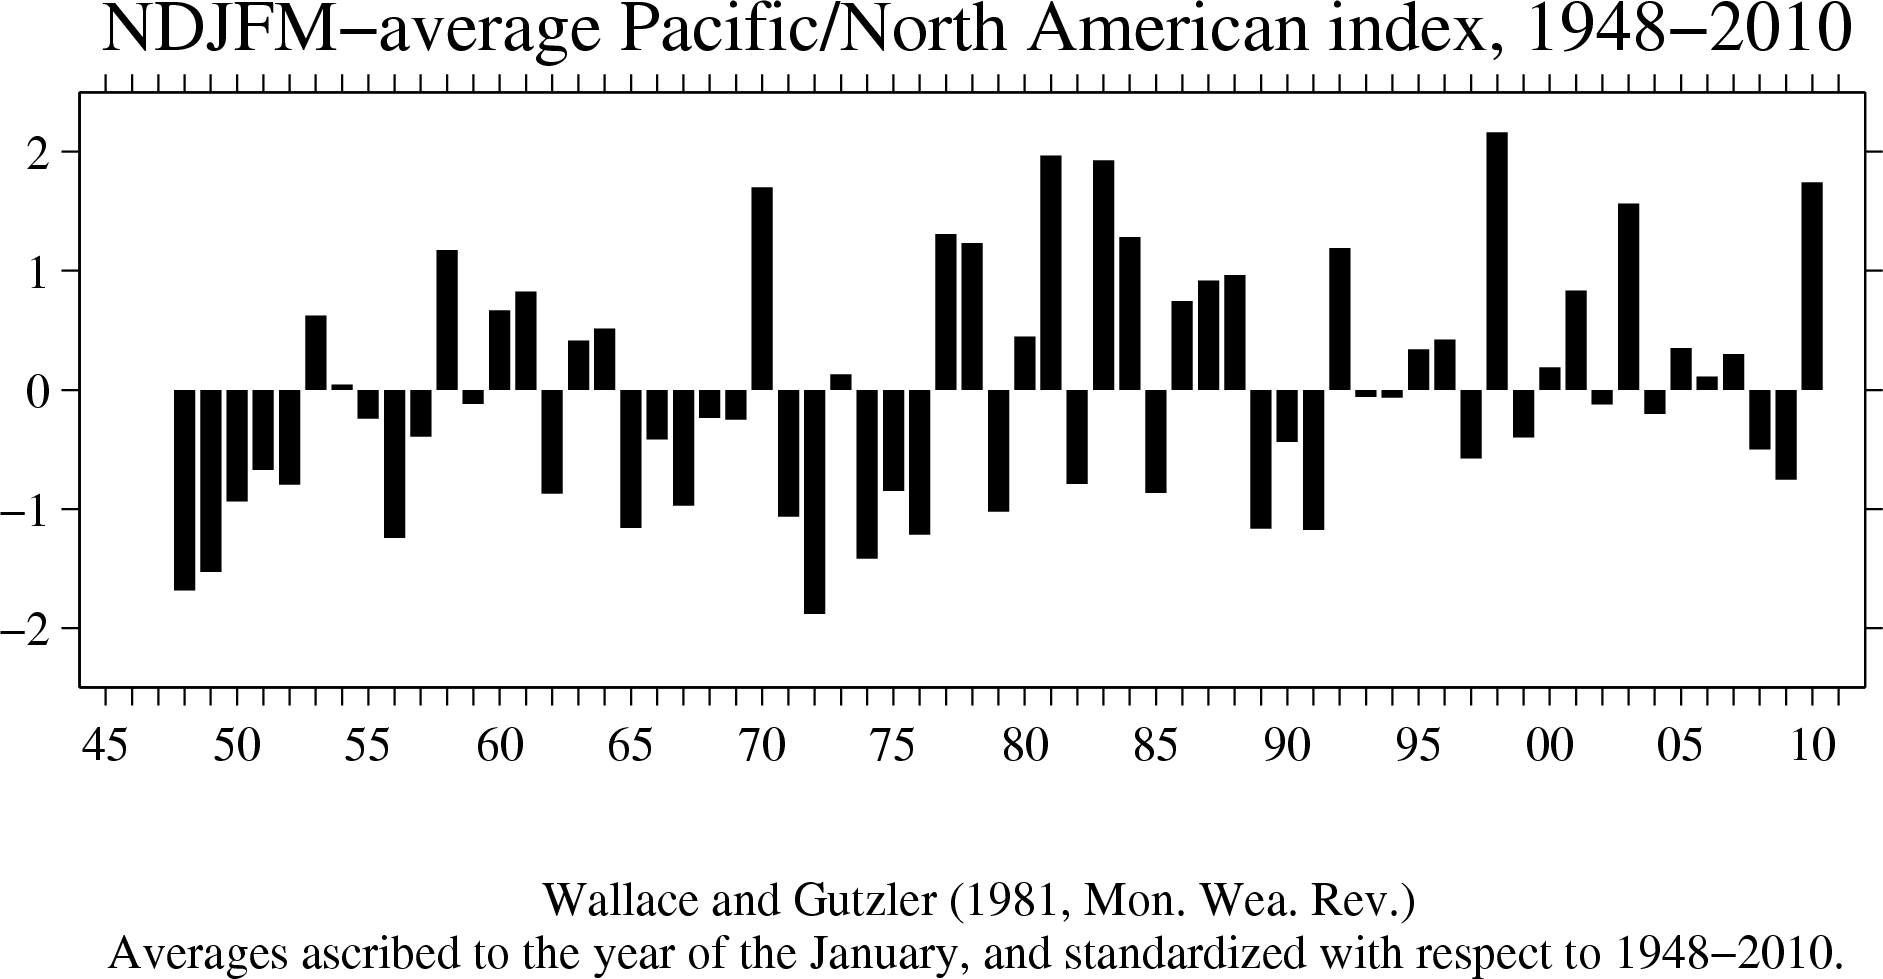
Digital values | DJF-averages | NDJFM-averages
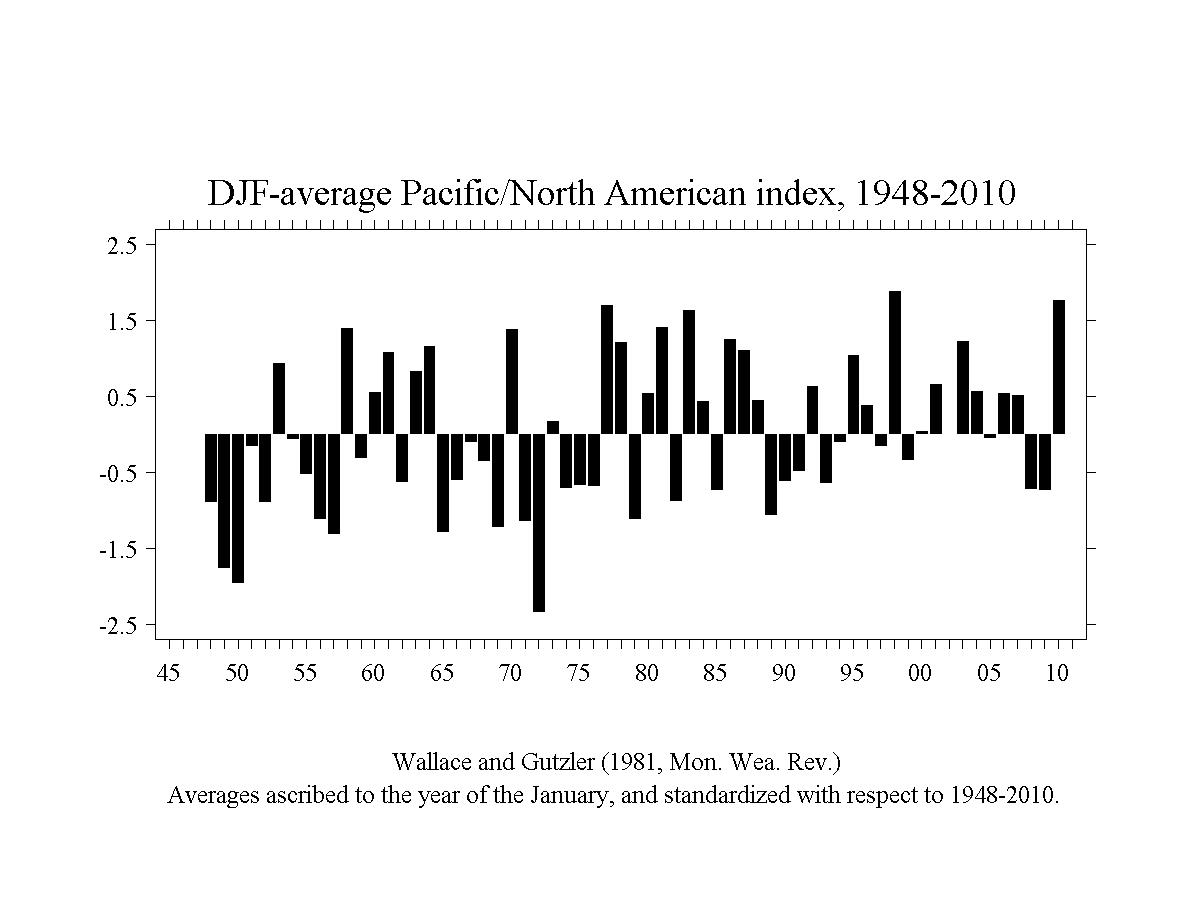
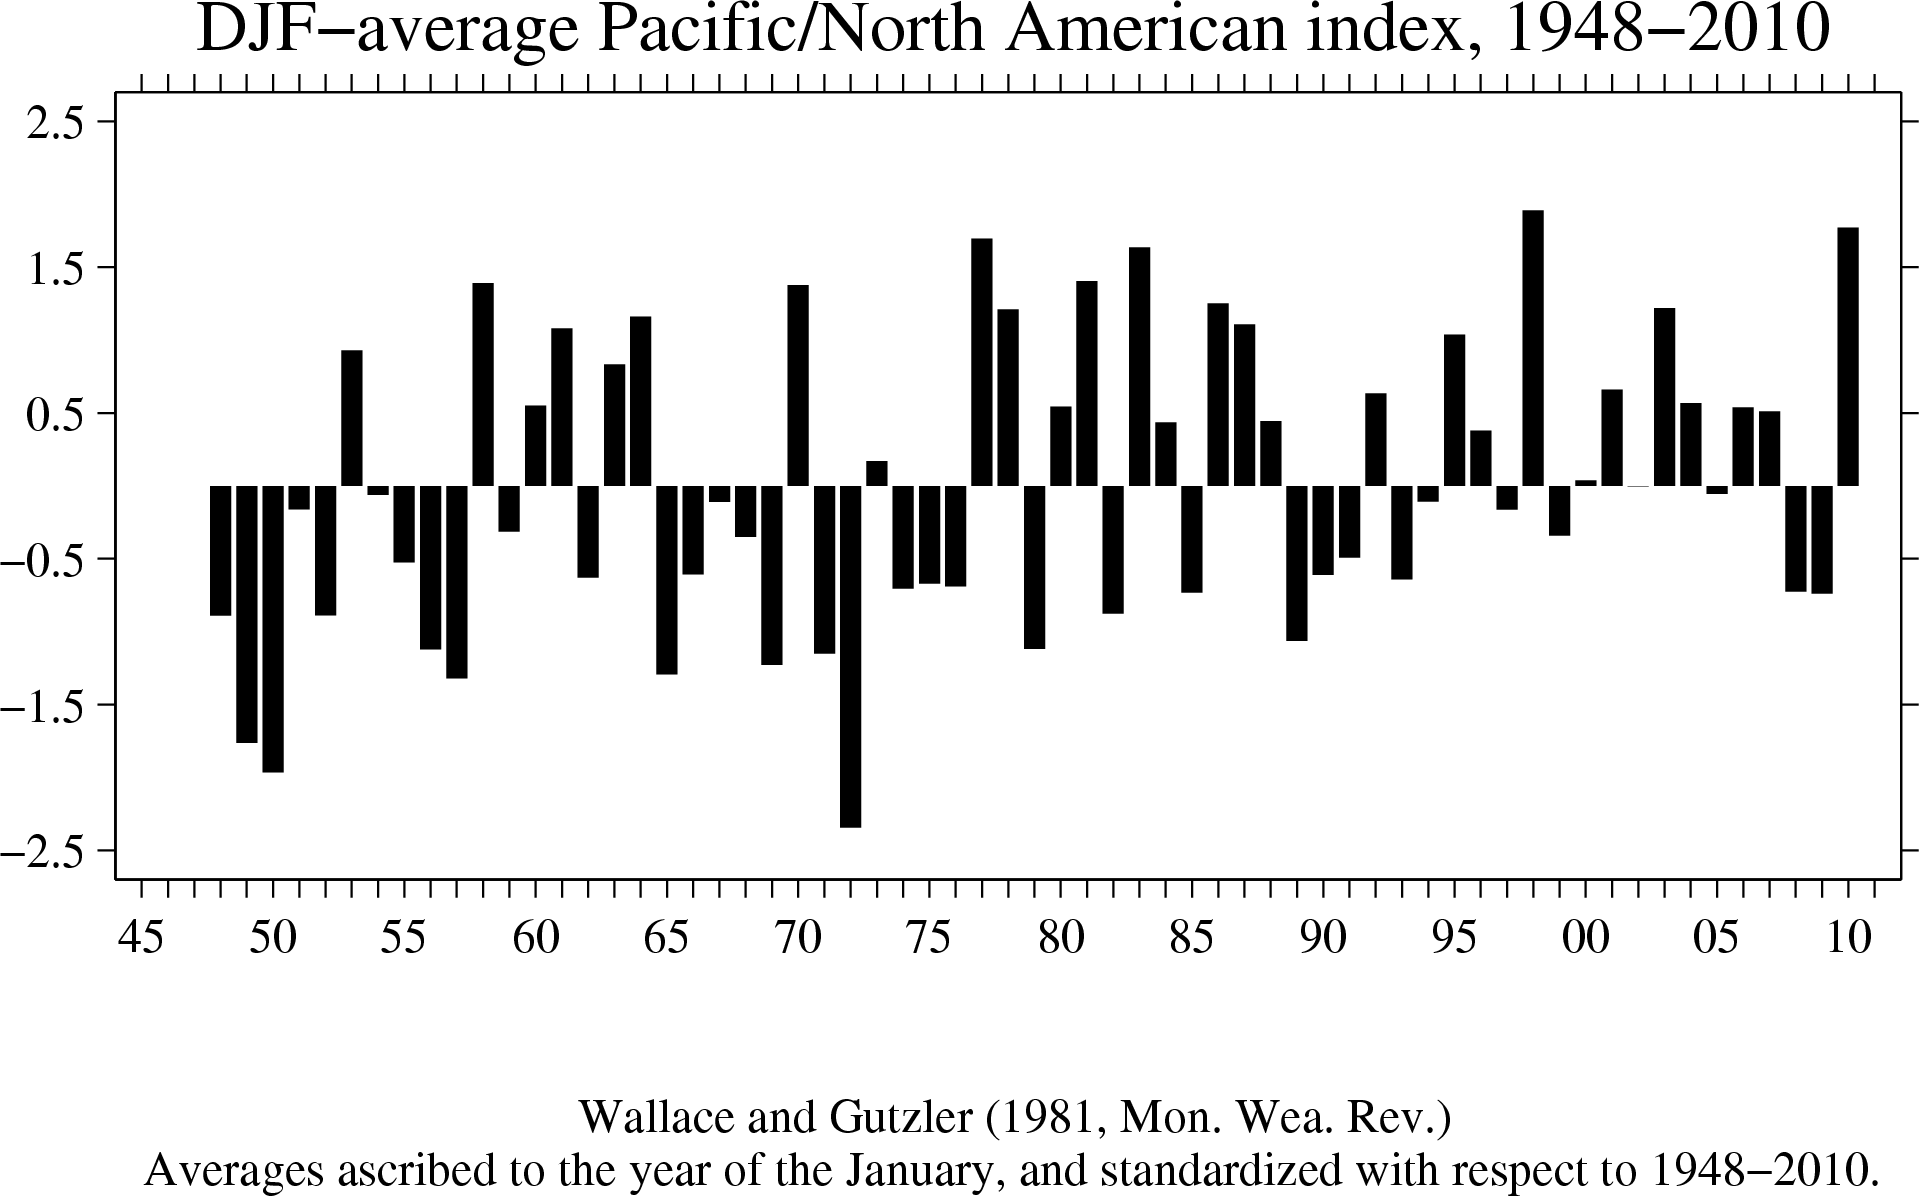
This page contains the PNA index derived from the formula in Wallace and Gutzler (1981):
The time series for each of the 4 grid points are standardized for each calendar month using 1948-2007 as the climatology, and the resulting PNA series is normalized using the standard deviation of the combined December, January, February values of 1948-2007. The choice of 1948-2007 for the climatology is arbitrary. The data employed is the NCEP / NCAR reanalysis.
The NOAA National Centers for Environmental Prediction Climate Predction Center also provide two versions of this index.
The time series:
       jan  feb  mar  apr  may  jun  jul  aug  sep  oct  nov  dec
 1948   11 -145 -172 -154   80   66  -18  -50  -38   29  -81 -135
 1949 -115 -149   16   79   22  -70  -20   41   75  -88  133 -141
 1950 -266  -38   29  -37  -61   53   34   99  146  -22  -57   73
 1951  -23  -86 -112   81  126    9    2   -5   77   -5   52 -118
 1952 -109   27  -93   80  -44  -96  -16    4   79  141   69  114
 1953   64   35  -92   64   46  -41   69   33   38  171   94   33
 1954  -98   53  -68 -150   26   -2  -67  -59  -57   96  211  -11
 1955   38 -145 -166  -79  -45   49  -24   19  -35  -18  -95  -72
 1956   -7 -174  -28   33  -18  -22   13   43  -15 -127  119   -9
 1957 -140 -149   61  -46   87    9   27  -22  118  184   47  -24
 1958  198  144   -8   80   75   73   30   31  -43   -4  -73   63
 1959  -38  -94  107   17  -39    9   40 -144  -42   36   41   46
 1960   18   63   36   32   20  -25  104  -56   36   52  -34  109
 1961  132    6   38  -39   41   59   36  105 -146 -163  -79  -46
 1962  -17  -79  -44   15 -157  -56  -32  -44  -38   40   79   58
 1963  -13  145 -144  -72 -118  -54  -69   49   92   42   22  167
 1964   16   82 -130 -119 -152   18  -24  -84  -85   60  -71 -130
 1965   -9 -152   12  -91 -126   23    1   -2  -95   35  -56  -95
 1966   41  -82   67  -13   -8   82   12   37  115  -37  -97   39
 1967  -54   -9 -174 -214  -29   53  -48   90  163  -10  -38 -117
 1968 -106  145   45 -115   40    6   22  -57  -27  -26  127  -94
 1969 -181   -3   75   56   72  149  -30  -19   24   68   97  147
 1970   35  132  106 -105   -6  108   27  -11 -103  -74  -57 -149
 1971 -132   22   -6  -18   57  -55   26   -3 -111  -95  -62 -246
 1972 -186  -98   23 -147   62  -32  -53   53 -139  -38   43  -72
 1973   25   87  -43   43   22   10  -22  -37   37  -91 -194   38
 1974 -165  -32  -77   -7 -102  -38  -34    1  -32   61  -35   35
 1975 -118  -67  -70 -118  -25  -48  106 -100   48 -125  -69  -19
 1976   -1 -135 -145   -6   10  -83   39   -8   80   66  139   69
 1977  144  174 -128  -15  -39  -14 -139    1 -108   55   26  -11
 1978  118  169   73  -15  -30 -101  -12  -88  -31   24 -107 -123
 1979  -13 -117   50  -86   48 -108    7   26   66  108   59   15
 1980  -25  135  -48  190   75  -89  -78 -101  -68  128   95   78
 1981  218   25  181  -92  159  -45  -28  121   30 -122   93   28
 1982  -89 -136 -135  -95    1   29    1  -40   48  -38  -18   42
 1983  156  175  231   88   30   96  -19  -43  -60  -34  131  -31
 1984   42   89  159  112  -39    3   15  -22  -50  -34    1 -196
 1985  137 -106  -98  -72  -48  -53   74  -45  -95 -158 -174  127
 1986  133   26  116  -51   33    9  -73   73 -129  117  -83  111
 1987  107   35  109  140  -80  -17   19  -51   80   89  101   -7
 1988   36   73   90   91   71  103    5   43  -35   80  -59  -16
 1989 -116 -107  -54  -33  -93   -8   -1   60   33  -94  -32   89
 1990  -95 -132   38   56  -24  -73   40   42   49  -98 -149 -162
 1991  -21   73  -98   31  -18  -84  -12   27   33  -64   48  -17
 1992  111   51  169   66    4  107  -60   34 -163   24   10 -161
 1993  -57   74  116  160  103   10  -97   19  -85   31  -45   87
 1994   22 -132   49   27   53  -54   23   66   49    8 -180   74
 1995  141   23   47    5   63  157   -4 -106  144  -55   24  121
 1996  -31   -2   17  122  -40  -60  -19    7   19  -37  -57  -96
 1997   33   27  -81  112  -39  109    1   25   76   53   84  129
 1998   90  211  143  103   12  -71   83   28   24   -9  -40  -55
 1999  -27    6   -4  -41  -40  -51  -95   56   83  -14   -1   13
 2000  -67   64   49   15  -71  -67  -33  -97    2  -21   42   99
 2001  145  -93   60  -89   25 -119  -44    2   60  -70   73   10
 2002  -33   24 -110  -91 -102   86   54   37  -58   -3  170  115
 2003  138   26   26  -12  -19   39   43   83   96  126 -145   45
 2004    3   83  -47   97 -128  -19   83   79  -23 -104   -5   21
 2005  -25   -6  124  140  166   22  -56   17  -91   29   -6  151
 2006    6  -33  -83  -20   32  107   49  -82   94  -63  -22   98
 2007   20    0   -3  106   75    6  142  -76 -109  -16  -10  -91
 2008  -72    0   23  -90   93  -67  -12   98   37   24   83 -106
 2009   32  -93 -144  -42  -11   63  124   54  135    9  -47   53
 2010  158  193  172   42    9    7    6  -40   10  111
Digital values * 100
        +0    1    2    3    4    5    6    7    8    9
 1940                                          -89 -176
 1950 -196  -16  -89   93   -6  -52 -112 -132  139  -31
 1960   55  108  -63   83  116 -129  -61  -11  -35 -123
 1970  138 -115 -234   17  -71  -67  -69  169  121 -112
 1980   54  141  -88  164   43  -73  125  111   44 -106
 1990  -61  -49   63  -64  -11  104   38  -16  189  -34
 2000    4   66    0  122   57   -6   54   51  -73  -74
 2010  177
Digital values * 100
        +0    1    2    3    4    5    6    7    8    9
 1940                                         -169 -153
 1950  -94  -67  -80   62    4  -24 -124  -39  118  -12
 1960   67   82  -87   41   51 -116  -42  -97  -24  -25
 1970  170 -107 -188   13 -142  -85 -122  131  123 -102
 1980   45  197  -79  193  128  -87   75   92   97 -117
 1990  -44 -118  119   -6   -6   34   42  -57  216  -40
 2000   19   83  -12  156  -20   35   11   30  -50  -75
 2010  174