Analyses | Data
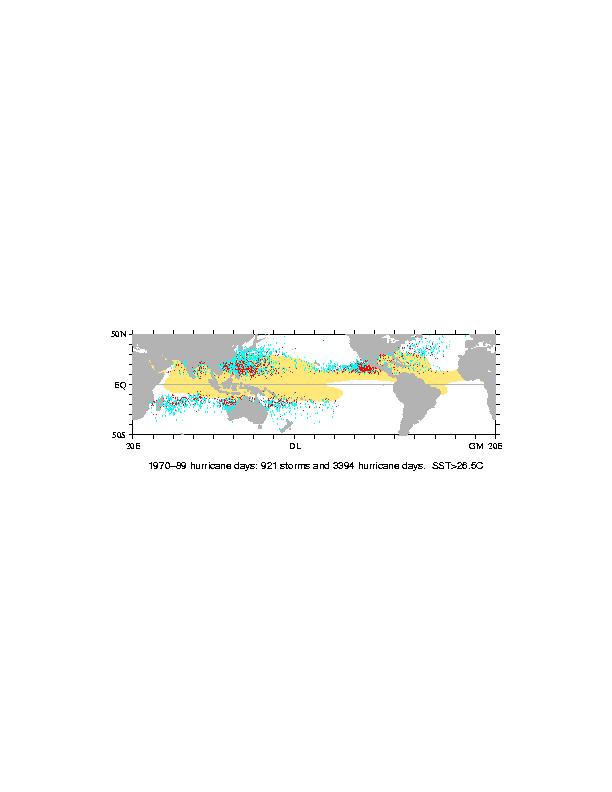
Distribution of hurricanes
big GIF | JPEG | PS
Analyses | Data
Distribution of hurricanes
big GIF | JPEG | PS
Four-times daily cyclone position data is available from the NOAA National Hurricane Center (Atlantic and eastern Pacific only) and from the National Center for Atmospheric Research (all oceans). I have taken the original four-times daily data in various formats and written a table in a single format with one record each day for each storm.
The notes on the data set at the NCAR WWW site are excellent, and you should read them if you want to use this data set.
Data:
1) Monthly
number of Atlantic hurricanes and named tropical storms for
1948-present. Calculated by Cathy Smith of NOAA Climate Diagnostics
Center.
2) Daily cyclone positions as ASCII tables
 The columns in each table are:
   1     2   3     4   5   6       7       8    9  10
 storm year month day lat lon storm_type speed slp SS

where
  storm is the number of the storm for that basin.  For the Atlantic
    this number ranges from 1 to 959.
  year and month are the year and month that the storm was first
    identified in.
  day is the number of days that it has been a storm.  "Day" is not
    the day of the month.
  lat and lon are the latitude and longitude of the storm.
  storm_type 1 hurricane (maximum wind > 64 knots)
             2 tropical storm (34 knots < maximum winds < 64 knots)
             3 unknown speed (early records) or storm < 34 knots maximum winds
  speed slp are the wind speed (knots) and sea-level pressure (mb).
    NaN for missing.
  SS, the Saffir-Simpson hurricane scale.
     value    maximum winds
       0       speed < 64 knots
       1        64 <= speed < 82
       2        82 <=       < 96
       3        96 <=       < 113
       4       113 <=       < 135
       5            speed > 135
I have only retained one observation per day for each storm in the data set to make
it more compact. For each storm, I determined the last observation
with the highest wind speed, and used observations for that time of
the day as an indicator of the storm position. This choice was so
I could could determine landfall with the greatest precision. Frankly
I don't think that this choice is a big deal. For storms without wind
speed estimates, I used the time of the day of the first observation.