A larger version of this image is available.
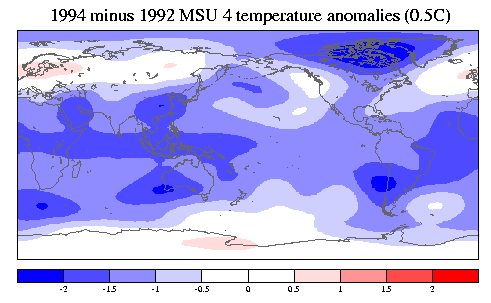
Temperature anomaly maps for individual months can be viewed through this link. You will need to select "stratosphere" on the display to see the MSU LS maps. I'm not sure if the "troposphere" maps are TLT or TMT.
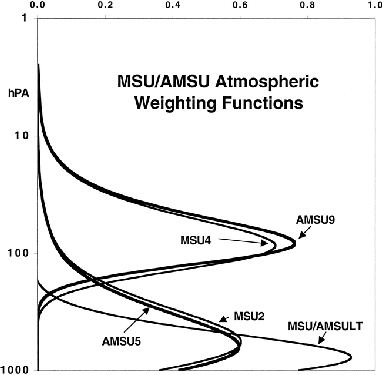
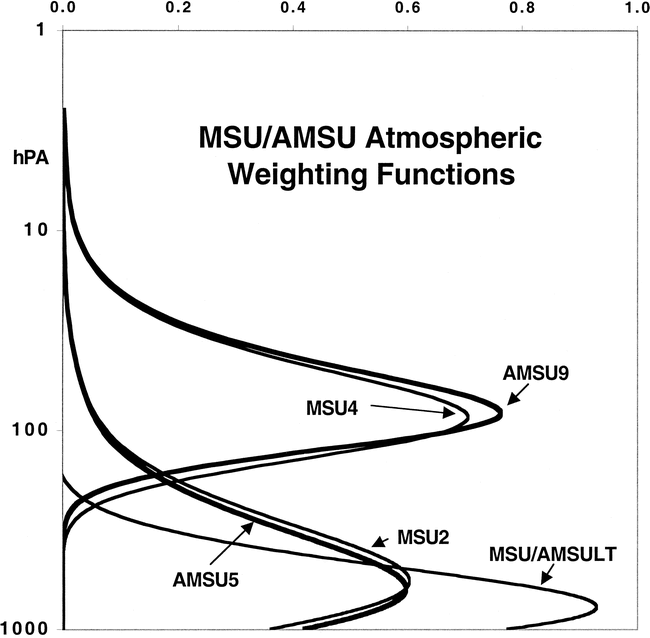
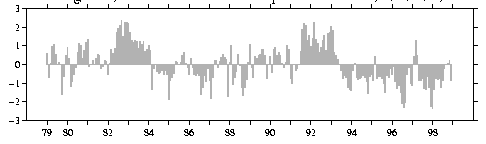
A large variety of phenomena can be studied with this data, for example the Quasi-Biennial Oscillation (QBO) and sudden stratospheric warmings. In the following, the dominant patterns of variability are documented in emiprical orthogonal functions (EOFs, spatial patterns) and associated principal components (PCs, amplitude time series) of correlation and covariance matrices of MSU LT, MT, and LS are presented.
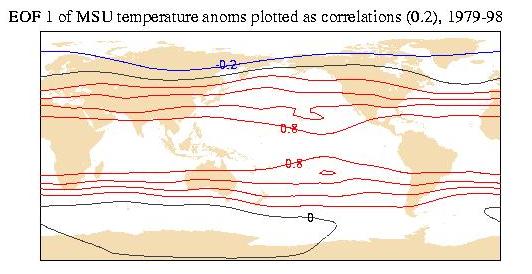
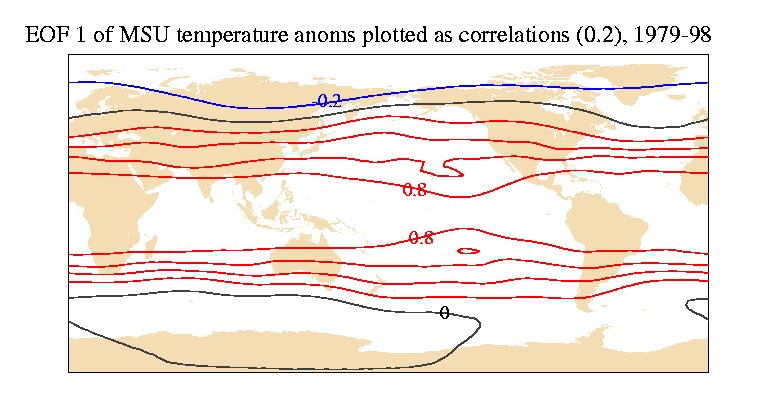
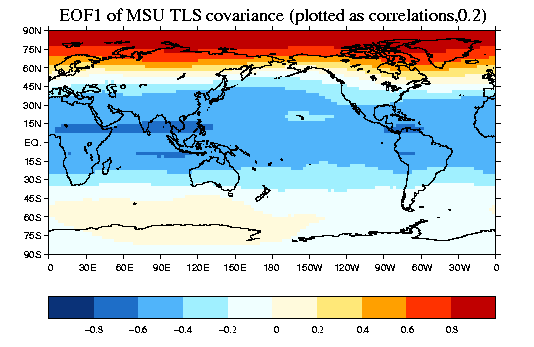
1a) Leading EOF/PC of TLS anomalies calculated from the correlation matrix.

PostScript | JPEG | PNG
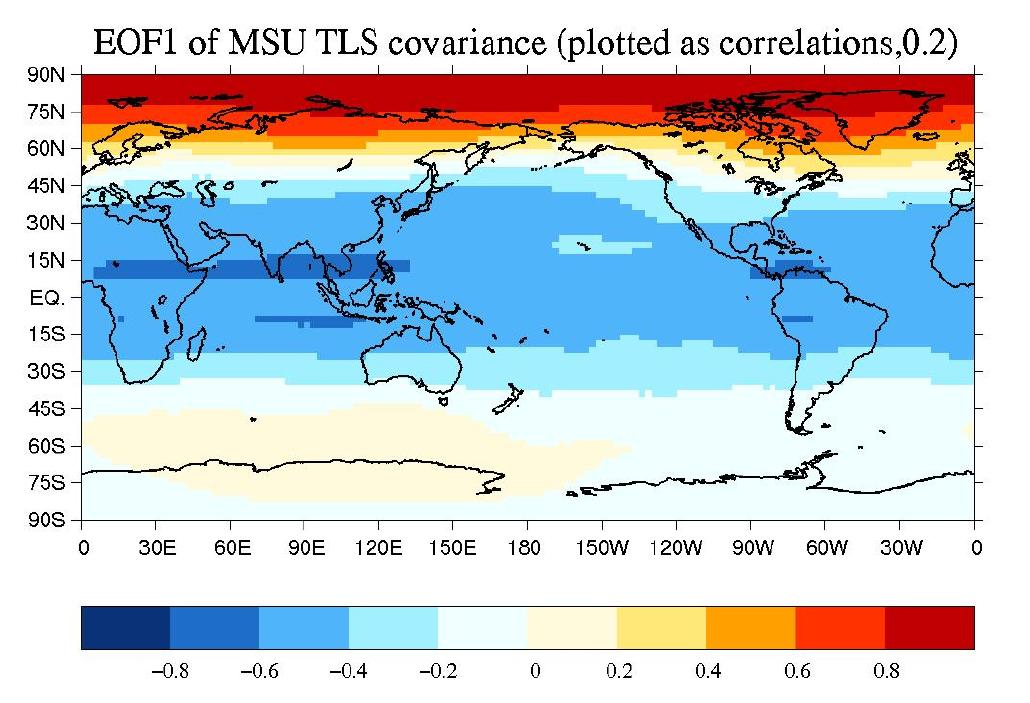
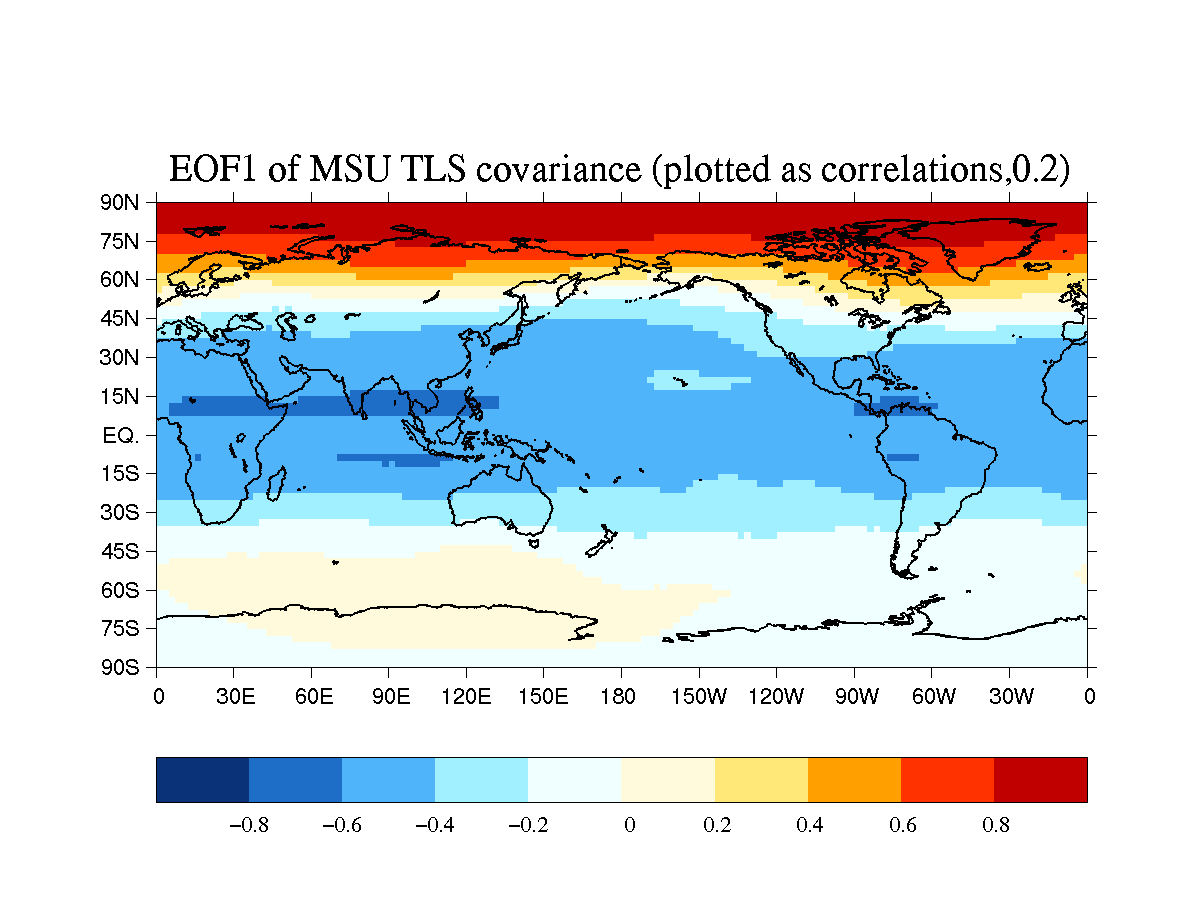
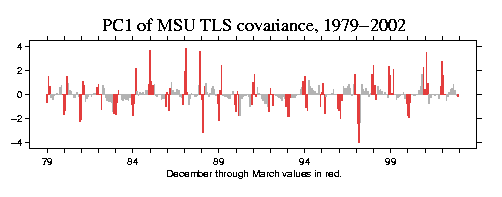
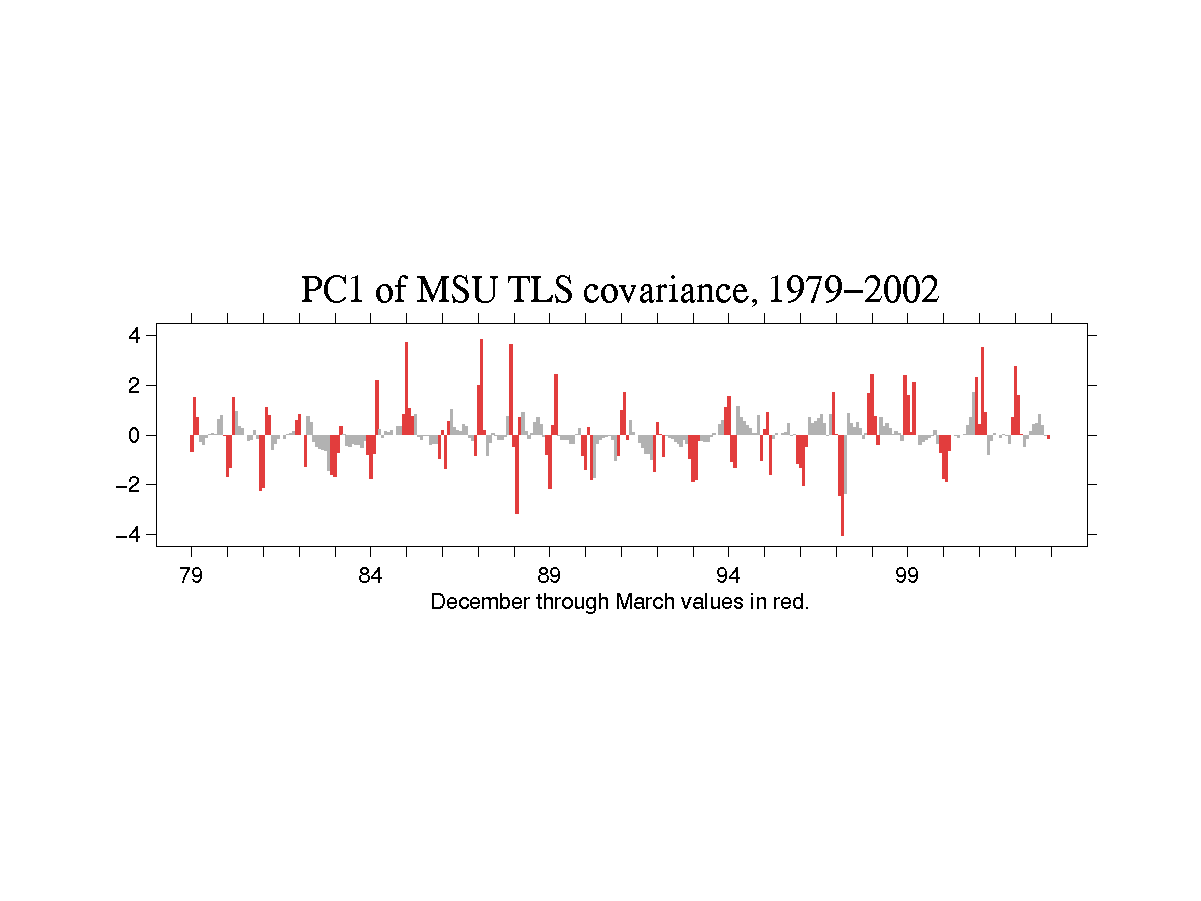
1b) Leading EOF/PC of TLS anomalies calculated from the covariance matrix.
PostScript | JPEG | PNG
PostScript | JPEG | PNG
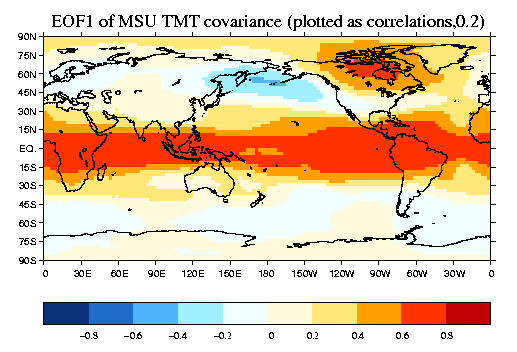
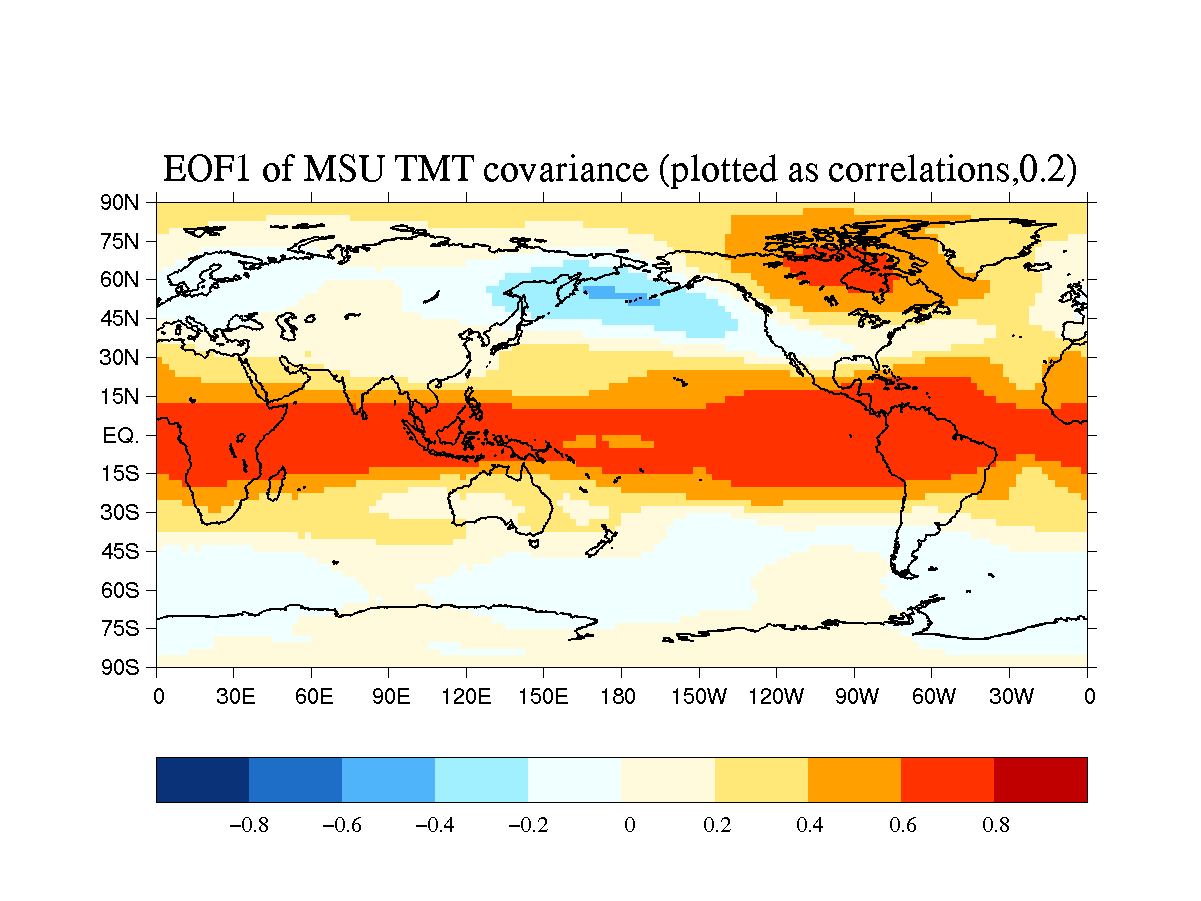
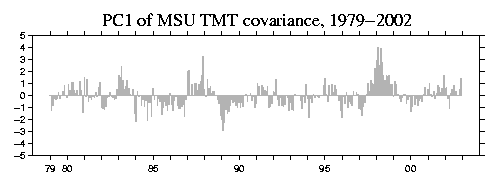
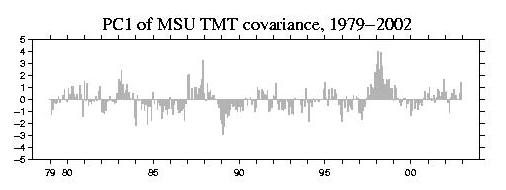
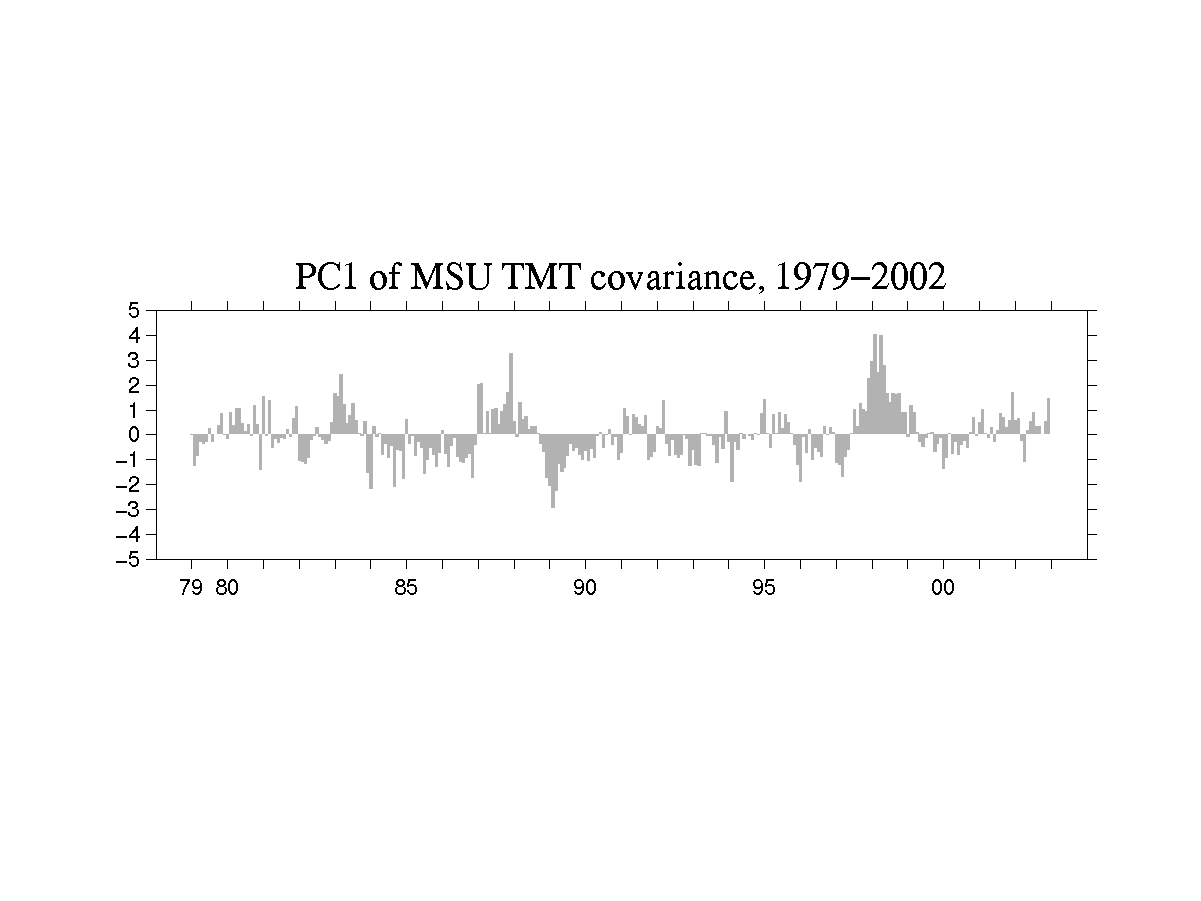
2) Leading EOF/PC of TMT anomalies calculated from the covariance matrix.
PostScript | JPEG | PNG
PostScript | JPEG | PNG
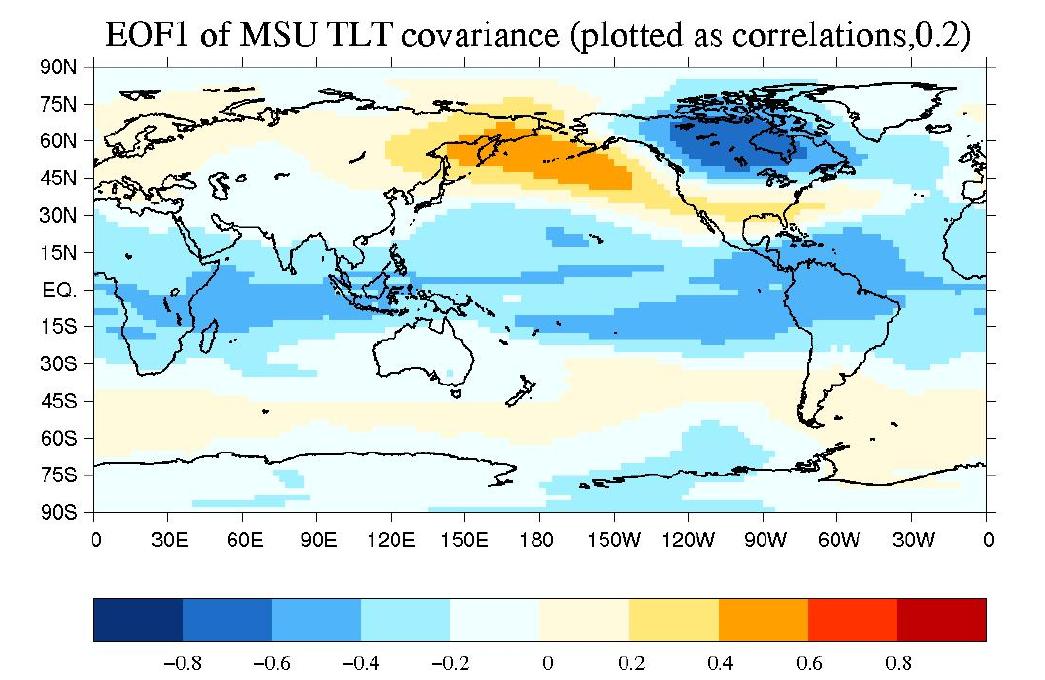
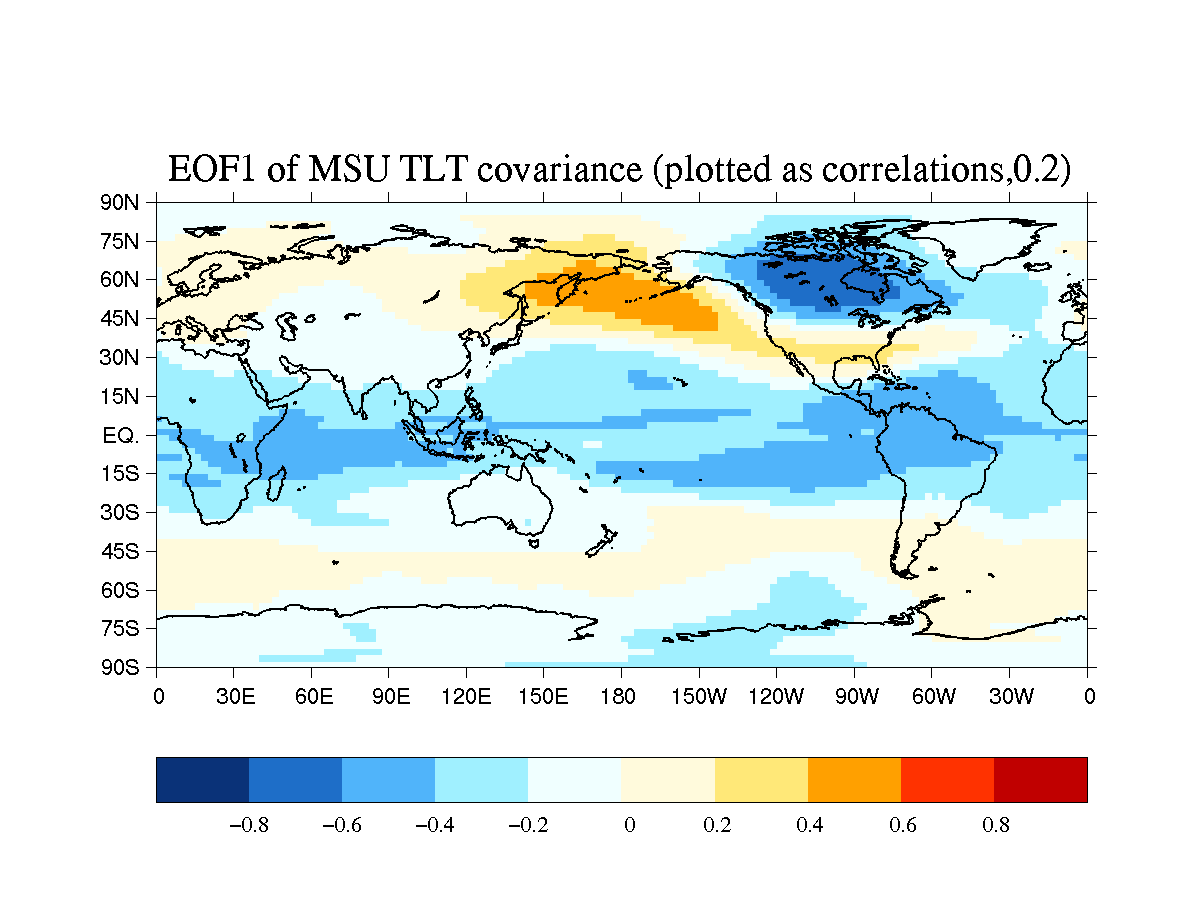
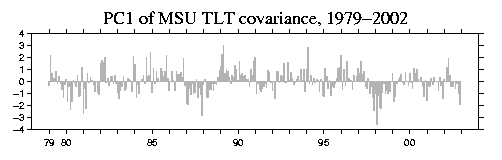
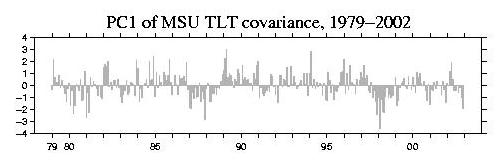
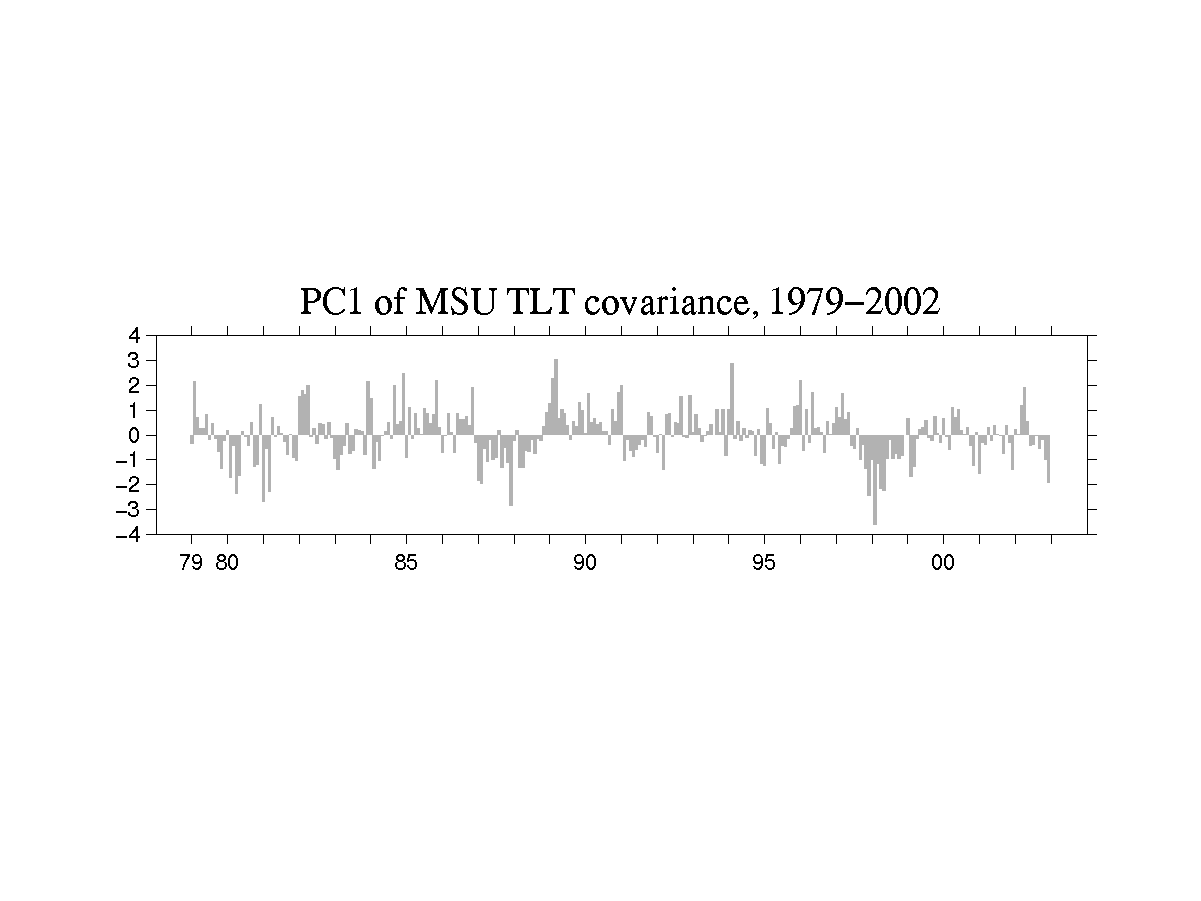
3) Leading EOF/PC of TLT anomalies calculated from the covariance matrix.
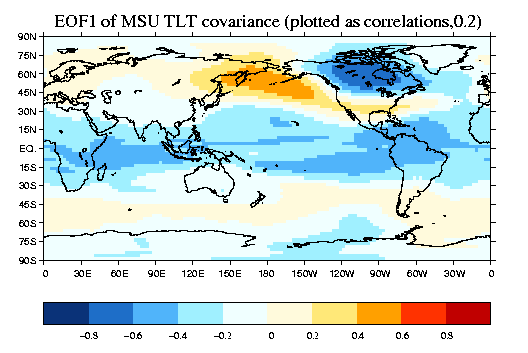
PostScript | JPEG | PNG
PostScript | JPEG | PNG
Data:
Reference:
Christy, J. R., R. W. Spencer, W. B. Norris, W. D. Braswell,
D. E. Parker, 2003: Error estimates of version 5.0 of MSU-AMSU bulk
atmospheric temperatures. J. Atmos. Oceanic Technol., 20, 613-629.