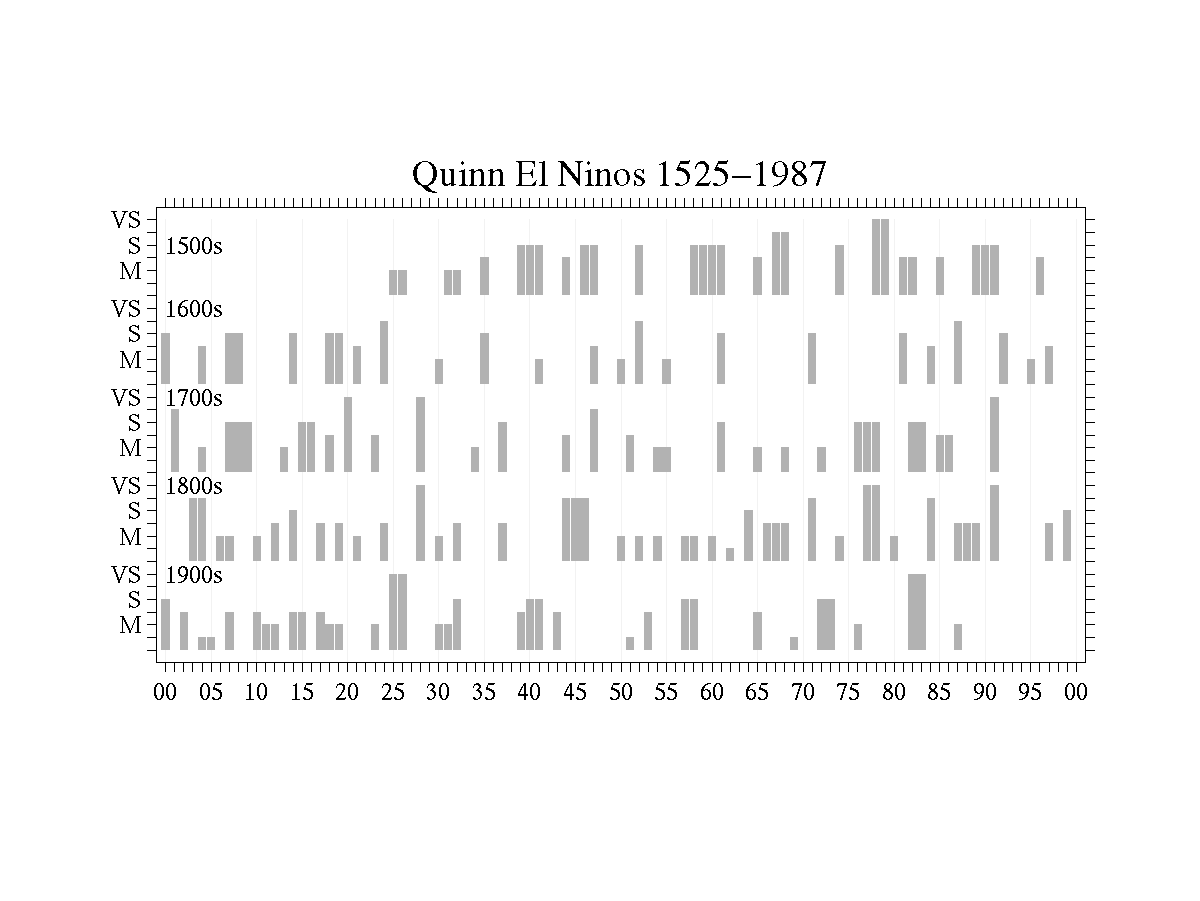
The information on this WWW page is taken from Quinn (1992). The assignments of strengths and El Niño years in Quinn (1992) is slightly different from Quinn et al. (1987), usually with the year of occurrence shifted by a single year or the magnitude of an episode altered. The Quinn et al. (1987) listing is linked here. It is probably best to use Quinn's last attempt at this characterization (Quinn 1992). The authors based their El Niño identification on a broad range of subjective and objective measures, which are described below. Luc Ortlieb has carried on the work of Quinn and collaborators, and I provide a reference to one of Ortlieb's publications below.
References:
The 1539-41, 1558-61, 1589-91, and 1707-09 episodes are designated by Quinn as M/S; 1844-46 as M/S+; and 1887-89 M-/M+ . These designations mean that the episode was of both magnitudes at different times. I have given these episodes the larger of the two numerical values.
The index is linked here in column format (year, index
value).
        +0    1    2    3    4    5    6    7    8    9
 1520                             2    2    0    0    0
 1530    0    2    2    0    0    3    0    0    0    4
 1540    4    4    0    0    3    0    4    4    0    0
 1550    0    0    4    0    0    0    0    0    4    4
 1560    4    4    0    0    0    3    0    5    5    0
 1570    0    0    0    0    4    0    0    0    6    6
 1580    0    3    3    0    0    3    0    0    0    4
 1590    4    4    0    0    0    0    3    0    0    0
 1600    4    0    0    0    3    0    0    4    4    0
 1610    0    0    0    0    4    0    0    0    4    4
 1620    0    3    0    0    5    0    0    0    0    0
 1630    2    0    0    0    0    4    0    0    0    0
 1640    0    2    0    0    0    0    0    3    0    0
 1650    2    0    5    0    0    2    0    0    0    0
 1660    0    4    0    0    0    0    0    0    0    0
 1670    0    4    0    0    0    0    0    0    0    0
 1680    0    4    0    0    3    0    0    5    0    0
 1690    0    0    4    0    0    2    0    3    0    0
 1700    0    5    0    0    2    0    0    4    4    4
 1710    0    0    0    2    0    4    4    0    3    0
 1720    6    0    0    3    0    0    0    0    6    0
 1730    0    0    0    0    2    0    0    4    0    0
 1740    0    0    0    0    3    0    0    5    0    0
 1750    0    3    0    0    2    2    0    0    0    0
 1760    0    4    0    0    0    2    0    0    2    0
 1770    0    0    2    0    0    0    4    4    4    0
 1780    0    0    4    4    0    3    3    0    0    0
 1790    0    6    0    0    0    0    0    0    0    0
 1800    0    0    0    5    5    0    2    2    0    0
 1810    2    0    3    0    4    0    0    3    0    3
 1820    0    2    0    0    3    0    0    0    6    0
 1830    2    0    3    0    0    0    0    3    0    0
 1840    0    0    0    0    5    5    5    0    0    0
 1850    2    0    2    0    2    0    0    2    2    0
 1860    2    0    1    0    4    0    3    3    3    0
 1870    0    5    0    0    2    0    0    6    6    0
 1880    2    0    0    0    5    0    0    3    3    3
 1890    0    6    0    0    0    0    0    3    0    4
 1900    4    0    3    0    1    1    0    3    0    0
 1910    3    2    2    0    3    3    0    3    2    2
 1920    0    0    0    2    0    6    6    0    0    0
 1930    2    2    4    0    0    0    0    0    0    3
 1940    4    4    0    3    0    0    0    0    0    0
 1950    0    1    0    3    0    0    0    4    4    0
 1960    0    0    0    0    0    3    0    0    0    1
 1970    0    0    4    4    0    0    2    0    0    0
 1980    0    0    6    6    0    0    0    2
Confidence index: minimum 2 to maximum of 5.
        +0    1    2    3    4    5    6    7    8    9
 1520                             2    2    0    0    0
 1530    0    2    2    0    0    2    0    0    0    3
 1540    3    3    0    0    4    0    4    4    0    0
 1550    0    0    3    0    0    0    0    4    4    0
 1560    4    4    0    0    0    2    0    5    5    4
 1570    0    0    0    0    3    0    0    0    5    5
 1580    0    3    3    0    0    2    0    0    0    3
 1590    3    3    0    0    0    0    2    3    0    0
 1600    3    0    0    0    3    0    0    5    5    0
 1610    0    0    0    0    5    0    0    0    4    4
 1620    0    2    0    0    4    0    0    0    0    0
 1630    2    0    0    0    0    3    0    0    0    0
 1640    0    2    0    0    0    0    0    3    0    0
 1650    3    0    3    0    0    2    0    0    0    4
 1660    0    2    0    0    0    0    0    0    0    0
 1670    0    3    0    0    0    0    0    0    6    0
 1680    0    2    0    0    3    0    0    4    0    0
 1690    0    0    3    0    0    2    0    3    0    0
 1700    0    5    0    0    2    0    0    3    3    3
 1710    0    0    0    2    0    3    3    0    2    0
 1720    5    0    0    4    0    0    0    0    5    0
 1730    0    0    0    0    2    0    0    3    0    0
 1740    0    0    0    0    3    0    0    5    0    0
 1750    0    3    0    0    2    2    0    0    0    0
 1760    0    5    0    0    0    2    0    0    3    3
 1770    0    0    2    0    0    0    3    3    3    0
 1780    0    0    3    3    0    2    2    3    0    0
 1790    0    5    0    0    0    0    0    0    0    0
 1800    0    0    0    5    5    0    3    3    0    0
 1810    2    0    2    0    3    0    0    4    0    3
 1820    0    4    0    0    4    0    0    0    5    0
 1830    2    0    5    0    0    0    0    4    0    0
 1840    0    0    0    0    5    5    5    0    0    4
 1850    4    0    3    0    3    0    0    5    5    0
 1860    4    0    2    0    5    0    4    5    5    2
 1870    0    5    0    0    4    0    0    5    5    0
 1880    3    0    0    0    5    0    0    4    4    4
 1890    0    5    0    0    0    0    0    4    0    5
 1900    5    0    5    0    5    5    0    4    0    0
 1910    4    5    5    0    5    5    0    5    5    5
 1920    0    0    0    5    0    5    5    0    0    0
 1930    5    5    5    0    0    0    0    0    0    5
 1940    5    5    0    5    0    0    0    0    0    0
 1950    0    5    0    5    0    0    0    5    5    0
 1960    0    0    0    0    0    5    0    0    0    3
 1970    0    0    5    5    0    0    5    0    0    0
 1980    0    0    5    5    0    0    0    4
Quinn and collaborators based their identification upon a literature search and, for the modern record, sea surface temperature observations at stations along the Peru coast (Quinn et al. 1987).
"In our search of the literature we looked for occurrences of the
following nature over the north Peruvian coastal region and its
adjacent waters:
1) significant variations on travel times between ports along the
coast of Peru (e.g., large increases in northward travel time and
decreases in southward travel time because of southward coastal
currents and / or winds),
2) data from ship logs (pirates, privateers, explorers, etc.) noting
unusual sea and weather conditions, sensing unusual sea and air
temperatures, sighting displaced continental vegetation, noting
displaced marine fauna, etc.,
3) presence of aguaje (red tide),
4) penetration of abnormally warm waters farther south than usual
along the coast of Peru during southern hemisphere summer and/or fall,
5) abnormally high air temperatures in the coastal cities of northern
Peru,
6) thunderstorms, heavy rainfall, and /or flood conditions,
7) destruction of buildings, houses, and sometimes whole cities in the
coastal zone by river inundations and flood waters,
8) obstructions to travel as the result of destruction of bridges,
roadways, and/or railroad facilities by hydrological forces,
9) destruction of agricultural crops,
10) significant rises in sea temperatures and sea levels,
11) southward invasions of tropical nekton,
12) mass mortality of endemic marine sea life,
13) death and/or departure of guano birds, and
14) reduction in coastal fishery and fish meal production."
The definition of El Niño posited by the Scientific Committee on Oceanic Research (1983) was employed: "El Niño is the appearance of anomalously warm water along the coast of Ecuador and Peru as far south as Lima (12 °S), during which a normalized sea surface temperature (SST) anomaly exceeding one standard deviation occurs for at least four consecutive months at three or more of five coastal stations (Talara, Puerto Chicama, Chimbote, Isla Don Martin, and Callao)." The SCOR definition employed 1956-81 for the climatology.
El Niño's with confidence ratings of 1 are not listed in the table "since they were merely listed by an author, without any source reference or informational basis,and one of our goals was to elimainate unsubstantated events. The other ratings are as follows: 2, event based on limited circumstantial evidence; 3, additional reference desired to firm up the time of occurrence or intensity; 4, occurrence time and intensity information is generally satisfactory, but we would like additional references as to areal extent; 5, the existing occurrence and intensity information is considered to be satisfactory."
Reference:
Scientific committee on oceanic research (SCOR) 1983: Prediction of El
Niño. Proceedings No. 19 Paris. Annex VI, SCOR WG 55 47-51.