Big GIF | PDF | PNG | PS
NSIDC provides references and extensive documentation for these timeseries.
From the NSIDC files for the Northern Hemisphere data:
the 'extent' column includes the area near the pole not imaged by the sensor. It is assumed to be entirely ice covered with at least 15% concentration. However, the "area" column excludes the area not imaged by the sensor. This area is 1.19 million square kilometers for SMMR (from the beginning of the series through June 1987) and 0.31 million square kilometers for SSM/I (from July 1987 to present). Therefore, there is a discontinuity in the "area" data values in this file at the June/July 1987 boundary.
Data:
Northern Hemisphere ice extent in percent * 100
jan feb mar apr may jun jul aug sep oct nov dec
1978 1202 1412
1979 1554 1631 1645 1546 1406 1259 1047 815 720 939 1116 1354
1980 1496 1598 1613 1549 1404 1231 1039 804 785 946 1169 1372
1981 1503 1565 1561 1512 1390 1257 1062 786 725 919 1117 1374
1982 1526 1606 1615 1557 1417 1269 1075 826 745 998 1191 1383
1983 1510 1602 1610 1530 1354 1235 1091 836 752 964 1164 1344
1984 1461 1532 1562 1515 1368 1220 1015 787 717 884 1129 1318
1985 1486 1567 1606 1534 1423 1240 1009 746 693 888 1139 1319
1986 1502 1589 1608 1515 1352 1210 1047 801 754 989 1178 1340
1987 1520 1611 1595 1533 1381 1257 998 769 748 929 1152
1988 1561 1613 1521 1369 1202 1004 790 749 947 1169 1378
1989 1512 1556 1552 1444 1298 1231 1038 792 704 952 1150 1347
1990 1495 1556 1588 1468 1330 1168 962 682 624 935 1131 1327
1991 1446 1526 1550 1493 1351 1223 968 740 655 916 1112 1317
1992 1472 1550 1547 1470 1325 1213 1061 786 755 960 1187 1346
1993 1508 1573 1588 1518 1354 1199 966 729 650 918 1173 1352
1994 1482 1561 1558 1495 1373 1210 1022 761 718 948 1130 1353
1995 1462 1524 1532 1459 1304 1155 915 668 613 894 1097 1298
1996 1421 1517 1513 1422 1306 1210 1036 817 788 939 1056 1314
1997 1447 1552 1558 1459 1332 1191 959 730 674 876 1091 1329
1998 1481 1577 1566 1489 1380 1185 962 749 656 885 1075 1326
1999 1447 1537 1540 1513 1386 1210 959 738 624 910 1099 1288
2000 1441 1518 1527 1463 1318 1171 975 721 632 892 1054 1281
2001 1431 1527 1561 1486 1372 1169 922 747 675 859 1092 1284
2002 1445 1536 1544 1437 1312 1169 949 653 596 881 1078 1282
2003 1446 1525 1549 1457 1300 1177 946 685 615 865 1029 1282
2004 1403 1493 1505 1411 1258 1151 960 683 605 848 1065 1272
2005 1366 1436 1474 1407 1299 1129 893 630 557 845 1047 1247
2006 1360 1442 1443 1397 1262 1106 867 652 592 833 984 1227
2007 1377 1453 1465 1387 1289 1149 813 536 430 677 1005 1239
2008 1404 1498 1523 1447 1316 1146 906 606 468 839 1063 1253
2009 1407 1485 1516 1459 1339 1149 882 626 536 750 1026 1248
2010 1378 1458 1510 1469 1310 1087 839 598 490 769 989 1200
2011 1355 1436 1456 1415 1279
Northern Hemisphere ice area in 10^5 km^2 (see discussion)
jan feb mar apr may jun jul aug sep oct nov dec
1978 89 108
1979 123 131 131 124 110 92 65 49 45 61 82 105
1980 118 128 129 124 108 89 64 48 48 64 86 107
1981 118 124 126 121 109 89 62 43 43 61 82 104
1982 121 127 129 125 111 94 67 49 43 66 89 108
1983 119 128 128 121 108 92 67 48 46 67 89 105
1984 116 121 124 121 108 90 61 45 40 58 81 101
1985 116 123 126 124 111 88 58 45 41 60 83 101
1986 117 125 126 119 106 89 65 49 46 67 88 104
1987 118 129 127 122 109 93 68 53 56 74 96
1988 134 138 131 113 96 69 53 53 74 98 119
1989 131 132 131 122 113 99 72 54 48 69 93 115
1990 127 133 134 121 108 91 64 49 45 66 95 114
1991 124 131 133 127 114 96 66 51 44 67 91 111
1992 125 135 134 127 113 98 71 53 53 76 96 116
1993 128 135 137 129 113 92 61 46 45 69 94 114
1994 128 134 134 128 116 96 68 51 50 71 96 114
1995 127 133 132 123 107 88 60 46 43 59 89 110
1996 120 129 128 122 112 97 73 56 55 74 87 109
1997 123 133 132 124 111 91 64 50 48 63 90 111
1998 127 137 135 127 113 91 63 46 42 66 88 108
1999 125 133 134 130 116 91 64 46 42 67 92 109
2000 122 130 131 125 111 89 63 47 43 66 88 109
2001 122 131 135 129 113 90 62 48 45 65 90 104
2002 121 133 133 123 111 91 63 42 39 62 86 105
2003 122 131 133 123 108 90 60 44 40 59 85 107
2004 121 128 129 120 108 91 64 45 43 63 89 109
2005 118 122 126 121 108 87 58 41 40 57 87 105
2006 115 122 124 119 103 83 57 42 39 57 80 101
2007 117 125 124 117 107 81 50 31 27 42 80 101
2008 118 128 131 124 108 84 57 34 29 54 87 106
2009 119 128 130 125 110 88 57 37 34 48 79 101
2010 115 125 131 124 104 79 52 35 30 51 80 100
2011 113 123 124 120 103
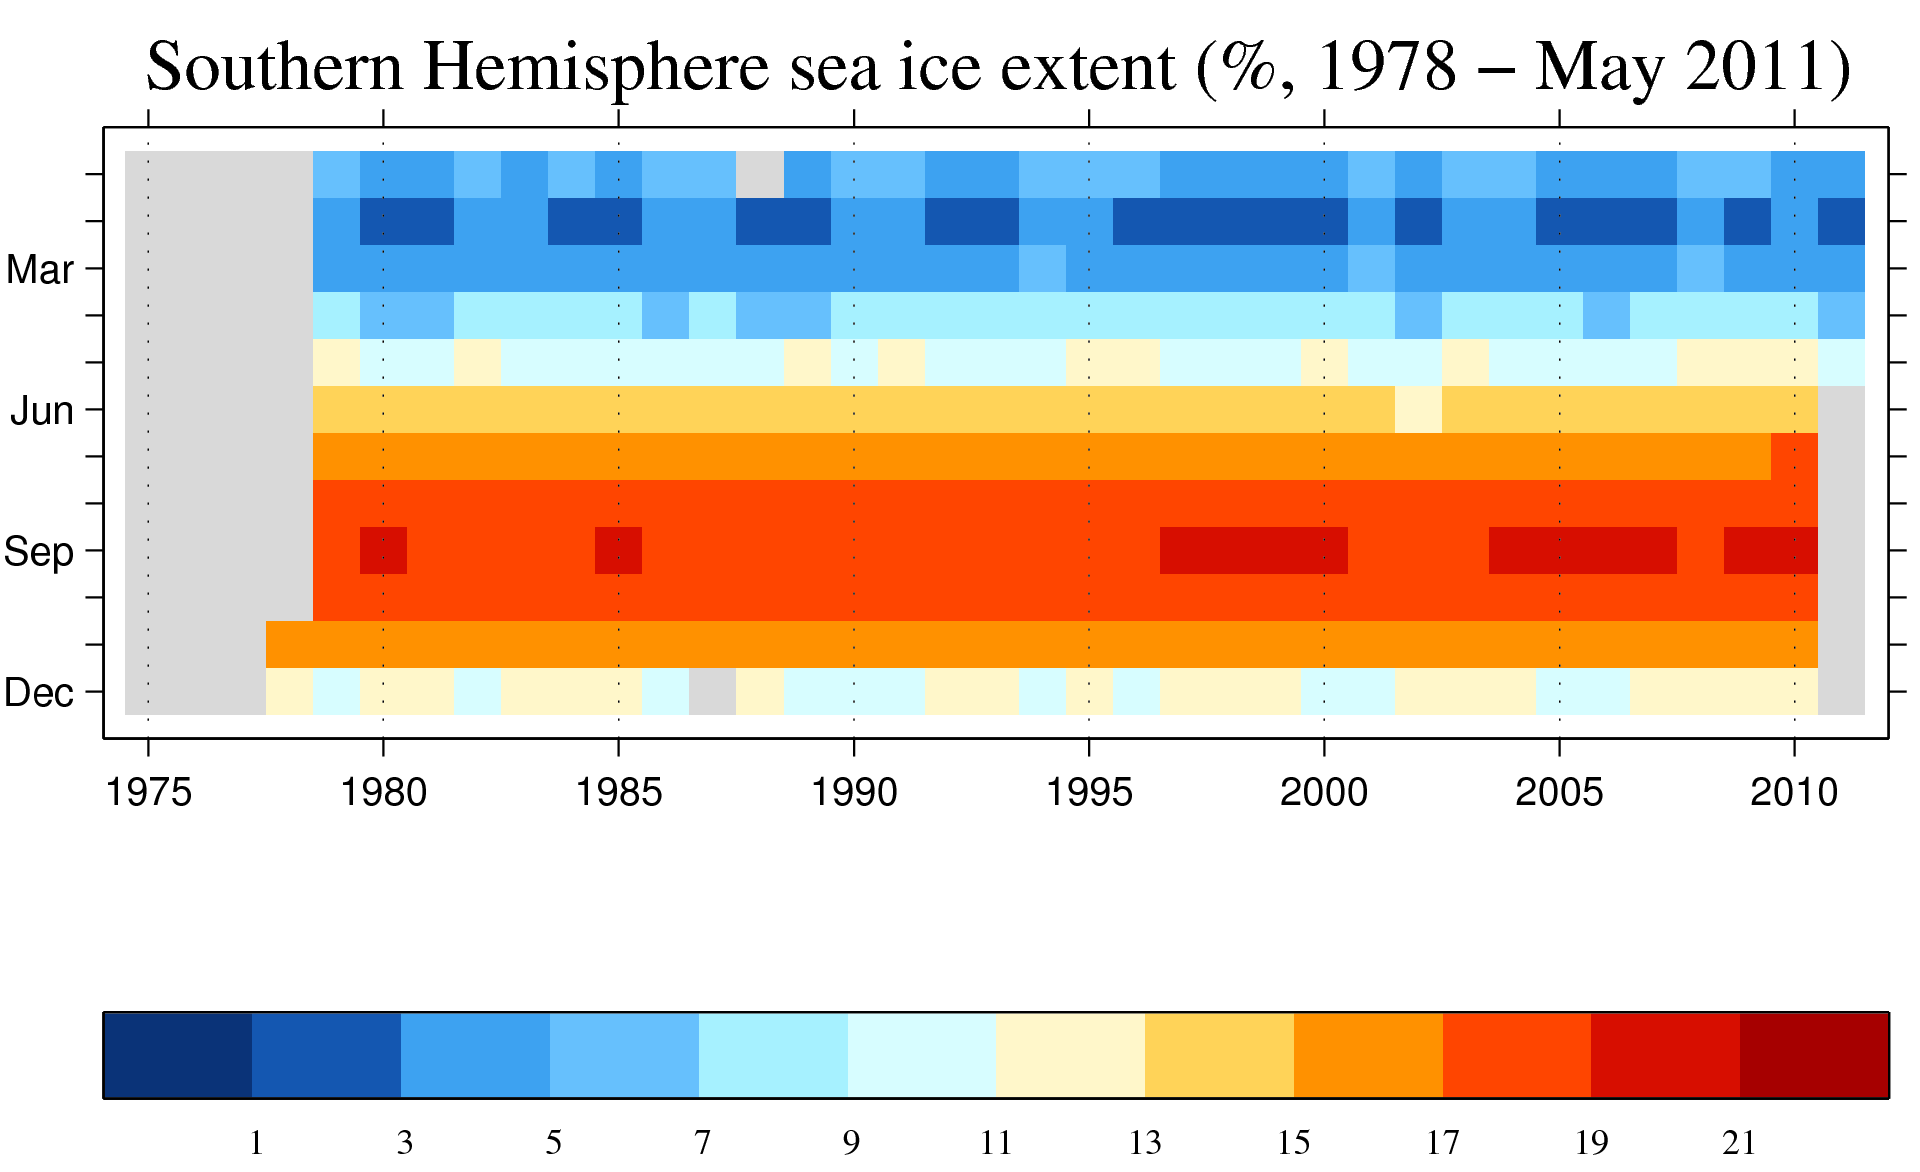
Southern Hemisphere ice extent in percent * 100
jan feb mar apr may jun jul aug sep oct nov dec
1978 1640 1138
1979 571 310 447 821 1143 1474 1683 1811 1840 1803 1587 1041
1980 472 283 354 593 946 1324 1609 1810 1906 1890 1671 1115
1981 449 287 366 631 1011 1392 1647 1823 1890 1854 1636 1219
1982 545 311 480 828 1116 1399 1625 1811 1863 1800 1602 990
1983 494 303 432 709 1009 1335 1593 1762 1884 1811 1631 1138
1984 515 271 393 702 1038 1394 1677 1814 1866 1775 1658 1147
1985 448 278 399 705 1086 1399 1609 1803 1902 1842 1641 1239
1986 558 319 408 691 978 1331 1582 1773 1797 1761 1554 1013
1987 517 324 442 736 1028 1331 1631 1797 1865 1801 1582
1988 283 435 685 1032 1360 1631 1811 1864 1860 1661 1222
1989 489 299 419 685 1117 1417 1614 1774 1827 1803 1608 1070
1990 512 301 436 748 1034 1375 1604 1796 1844 1818 1601 1066
1991 544 307 433 749 1108 1352 1621 1818 1856 1820 1605 1080
1992 484 286 407 742 1037 1334 1656 1818 1841 1822 1626 1122
1993 459 246 418 718 1059 1361 1640 1779 1867 1838 1640 1101
1994 519 315 507 767 1095 1413 1681 1824 1896 1826 1641 1068
1995 583 349 497 778 1111 1384 1620 1820 1873 1830 1597 1135
1996 617 289 461 799 1150 1438 1658 1814 1886 1817 1636 1053
1997 427 242 385 709 1084 1367 1642 1802 1915 1814 1625 1141
1998 445 299 465 756 1092 1398 1636 1819 1914 1882 1664 1138
1999 495 290 453 733 1089 1422 1676 1827 1902 1873 1632 1159
2000 482 284 443 777 1166 1441 1674 1861 1912 1846 1623 1082
2001 536 373 507 752 1096 1391 1619 1804 1840 1808 1576 1096
2002 470 286 394 699 998 1294 1593 1743 1818 1817 1591 1156
2003 620 387 481 777 1138 1448 1686 1805 1857 1837 1653 1138
2004 578 359 481 779 1095 1436 1674 1822 1913 1857 1657 1140
2005 493 293 447 750 1097 1394 1665 1826 1914 1870 1678 1073
2006 425 265 344 657 1018 1398 1663 1836 1936 1899 1676 1049
2007 487 288 409 701 1034 1387 1650 1804 1925 1868 1624 1267
2008 685 387 573 870 1153 1454 1659 1796 1853 1810 1660 1223
2009 590 291 500 838 1140 1439 1662 1857 1915 1855 1634 1135
2010 491 316 401 728 1148 1499 1716 1881 1916 1880 1690 1210
2011 468 247 361 674 1082
Southern Hemisphere ice area in 10^5 km^2
jan feb mar apr may jun jul aug sep oct nov dec
1978 115 68
1979 33 20 25 53 81 111 131 136 141 136 112 60
1980 29 17 20 35 63 94 120 138 147 144 117 63
1981 27 16 20 39 69 100 126 140 146 143 119 68
1982 31 18 27 57 81 104 123 142 144 136 111 61
1983 30 18 25 46 70 96 122 137 145 138 114 65
1984 27 16 22 44 73 105 132 141 141 136 119 67
1985 27 17 24 46 77 104 123 141 146 142 122 73
1986 32 19 23 44 69 96 120 133 137 132 107 63
1987 31 19 26 49 74 98 126 139 141 135 111
1988 18 25 43 71 101 125 138 141 143 121 72
1989 30 19 25 44 79 107 124 139 143 137 113 65
1990 32 21 27 51 73 102 121 139 143 137 112 65
1991 33 20 25 51 77 98 121 139 143 137 113 64
1992 31 17 23 49 75 99 124 140 140 137 110 60
1993 24 13 21 48 78 102 126 138 146 140 117 64
1994 32 21 31 53 81 106 130 143 145 139 116 69
1995 36 21 29 53 82 103 124 141 144 134 113 70
1996 34 16 25 52 85 110 127 138 144 138 111 60
1997 26 16 22 47 78 101 126 140 144 140 114 68
1998 29 18 26 50 78 102 125 139 147 144 117 66
1999 29 17 25 50 79 107 129 141 145 141 114 66
2000 27 16 26 52 84 109 128 145 149 141 117 67
2001 35 23 33 52 79 104 124 136 142 132 108 61
2002 28 17 22 44 70 96 124 136 140 137 115 74
2003 40 26 31 54 83 110 130 136 140 137 113 70
2004 36 22 31 53 80 108 130 141 145 140 116 67
2005 30 19 26 51 78 102 126 138 147 139 116 61
2006 26 17 19 42 70 104 127 144 150 145 115 62
2007 28 18 24 46 74 103 125 139 152 145 120 82
2008 39 23 36 61 85 113 128 139 142 140 118 71
2009 33 18 29 58 83 109 129 142 149 141 116 68
2010 31 20 25 48 81 115 136 147 142 142 117 66
2011 28 18 21 42 77