Analyses | Data: original, re-standardized
PostScript | JPEG
Analyses | Data: original, re-standardized
PostScript | JPEG
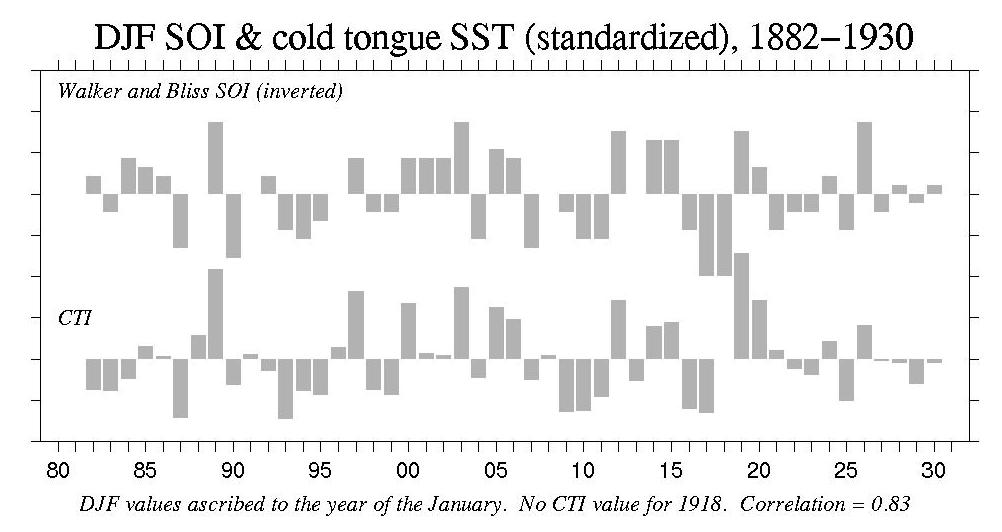
Walker and Bliss (1932, 1937) produced indices of the Southern Oscillation, the atmospheric part of the El Niño / Southern Oscillation (ENSO), from seasonal mean values of rainfall, surface temperature, and sea-level pressure. They performed what is essentially EOF analysis separately for each of the standard meteorological seasons, December-January-February (DJF), March-April-May (MAM), June-July-August (JJA), and September-October-November (SON). On the basis of extensive experimentation, Walker and Bliss chose the stations and variables that best explained the variability in each season. The stations and variables are different for each season. As practical issues, the period of record is different for the different seasons, and the index values for each season are standardized with respect to the period of record for that season's analysis. The digital values of the index, transcribed from the two referenced papers, are presented as a table. Negative (positive) values of their index are associated with above (below) normal values of sea surface temperature in the equatorial central and eastern Pacific Ocean.
The mean and
standard deviation for each seasonal time series are approximately 0 and
4.5, respectively.
The table as an ASCII file.
NaNs for missing values.
       DJF  MAM  JJA  SON
 1875         6    2   -1
 1876         1   -2    0
 1877       -12  -16   -9
 1878       -10    5    6
 1879         7    6    3
 1880         3   -4    0
 1881         0   -2    2
 1882   -2    4    0    4
 1883    2   -1    0    2
 1884   -4   -2   -2   -1
 1885   -3   -7   -2   -5
 1886   -2    2    4    5
 1887    6    6    1    0
 1888    0   -1   -5   -7
 1889   -8   -3    4    6
 1890    7    6    5    3
 1891    0   -5   -5   -3
 1892   -2    7    7    7
 1893    4    5    6    4
 1894    5    6    4    3
 1895    3    5    1   -3
 1896    0    2   -2    5
 1897   -4   -3    0    0
 1898    2    1    0    5
 1899    2   -1   -7   -5
 1900   -4   -9   -2   -1
 1901   -4   -2   -2   -2
 1902   -4   -4   -5  -10
 1903   -8   -4    2    4
 1904    5    1   -6   -1
 1905   -5   -9   -6   -4
 1906   -4   -3    3    4
 1907    6   -4   -4    1
 1908    0    1    2    3
 1909    2    4    6    5
 1910    5    5    5    6
 1911    5    0   -4   -4
 1912   -7   -3    0    1
 1913    0    3   -5   -5
 1914   -6   -5   -4   -9
 1915   -6   -5   -1    6
 1916    4    6    9    7
 1917    9    7    9    7
 1918    9    0   -6   -6
 1919   -7   -6   -4   -3
 1920   -3   -3   -1    4
 1921    4    4    3   -2
 1922    2    2    1    1
 1923    2   -1   -1   -2
 1924   -2    1    4    2
 1925    4    0   -1   -8
 1926   -8   -4   -1   -1
 1927    2    3    1   -3
 1928   -1    2    1    2
 1929    1    1   -1   -2
 1930   -1   -1   -4   -8
 1931         1        -1
 1932        -2         1
 1933         0         2
The data is offered in 3 formats:
A monthly index
It is useful to have a version of the series in which the various
seasonal series are merged into a "monthly" index. The merging is accomplished in three steps.
This is the processing for the (effectively) seasonal resolution (DJF, MAM, SON, ...)
plot at the top of this WWW page.
March 2001
Todd Mitchell (mitchell@atmos.washington.edu)
JISAO data