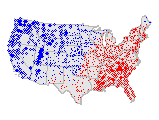
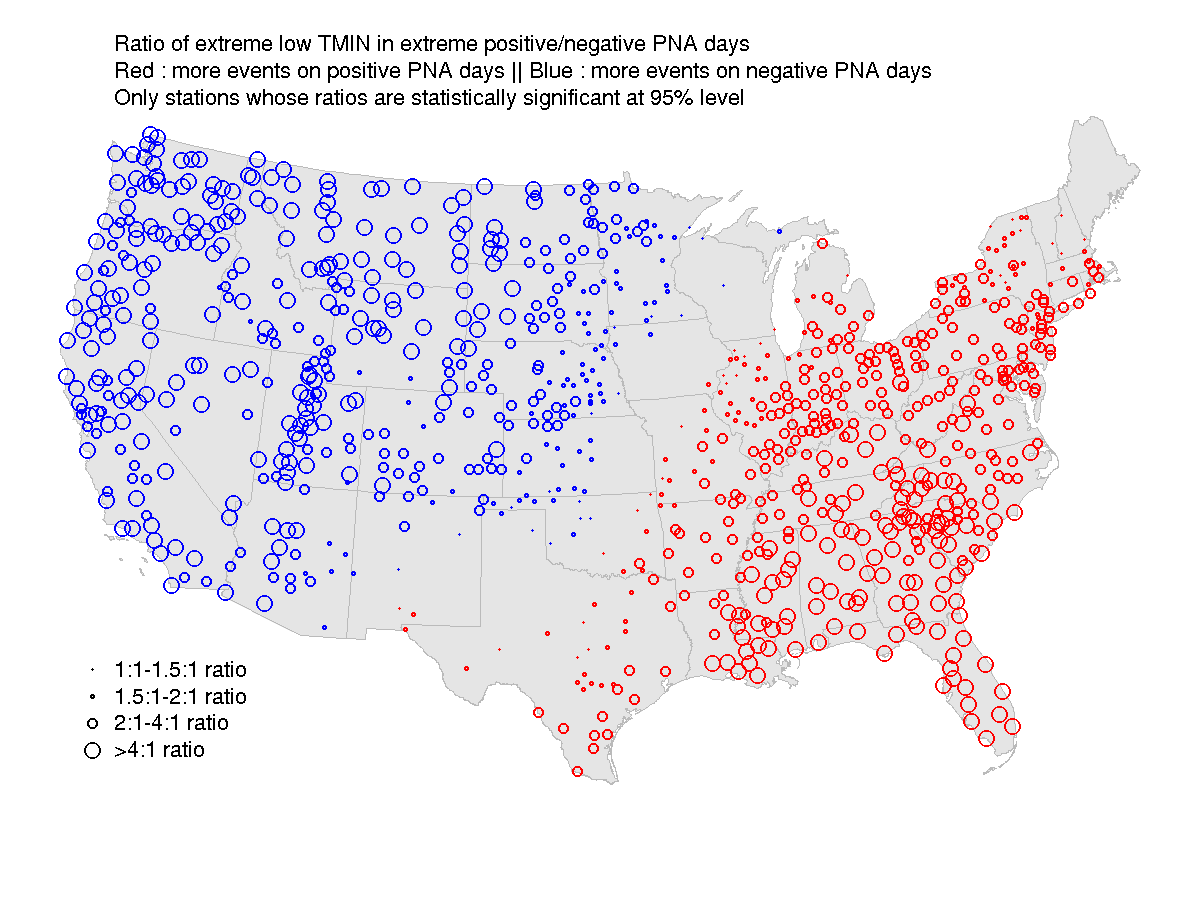
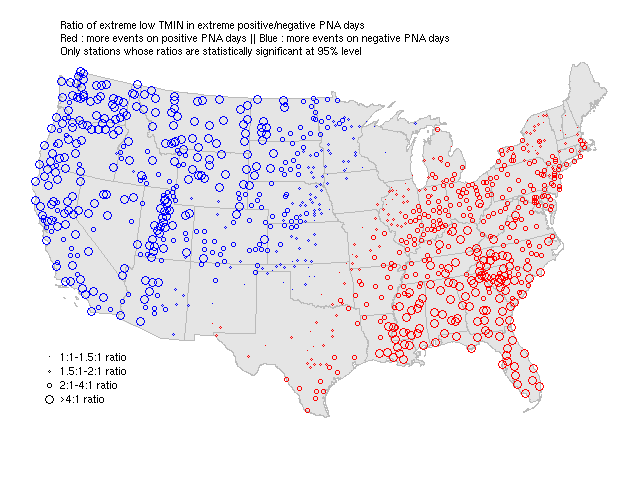
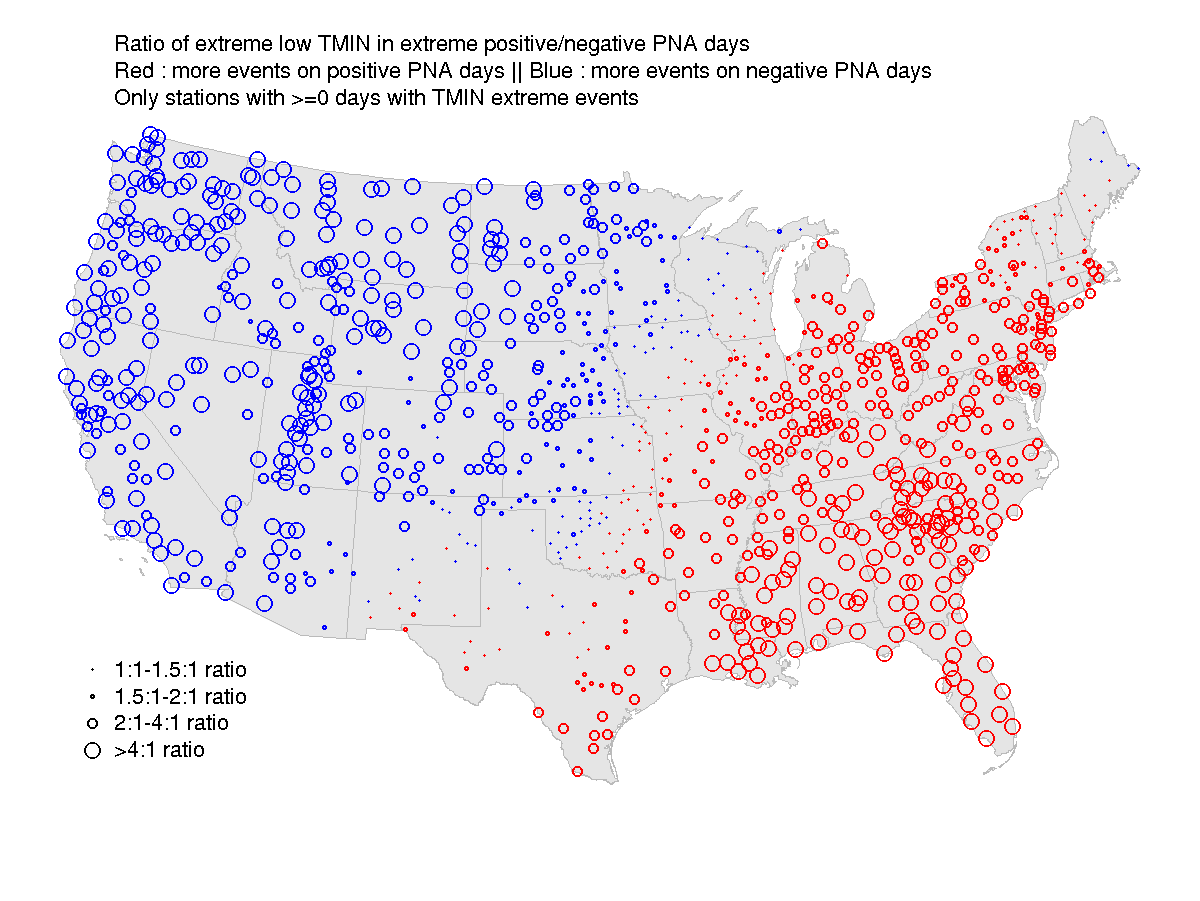
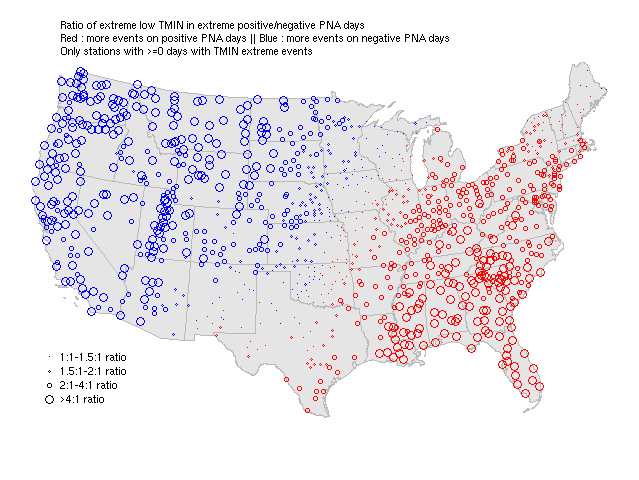
Stations whose TMIN/PNA ratios are statistically significant
PNG: (1200x900) | (640x480)
Open PNG in new window:
(1200x900) | (640x480)
Only PNG figures due to larger file sizes with terrain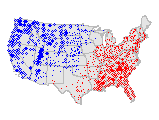