Ratios of any PRCP on extreme positive and negative PNA days

COOP Midwest main  |  Back to PRCP  |  Back to PNA and PRCP  |  Help

See these same figures WITH terrain elevation shown

Figures show results for sets of stations determined by certain criteria.
Choose a viewing option from the set in a row.  All figures in a row are the same, and a small version is shown on the right.

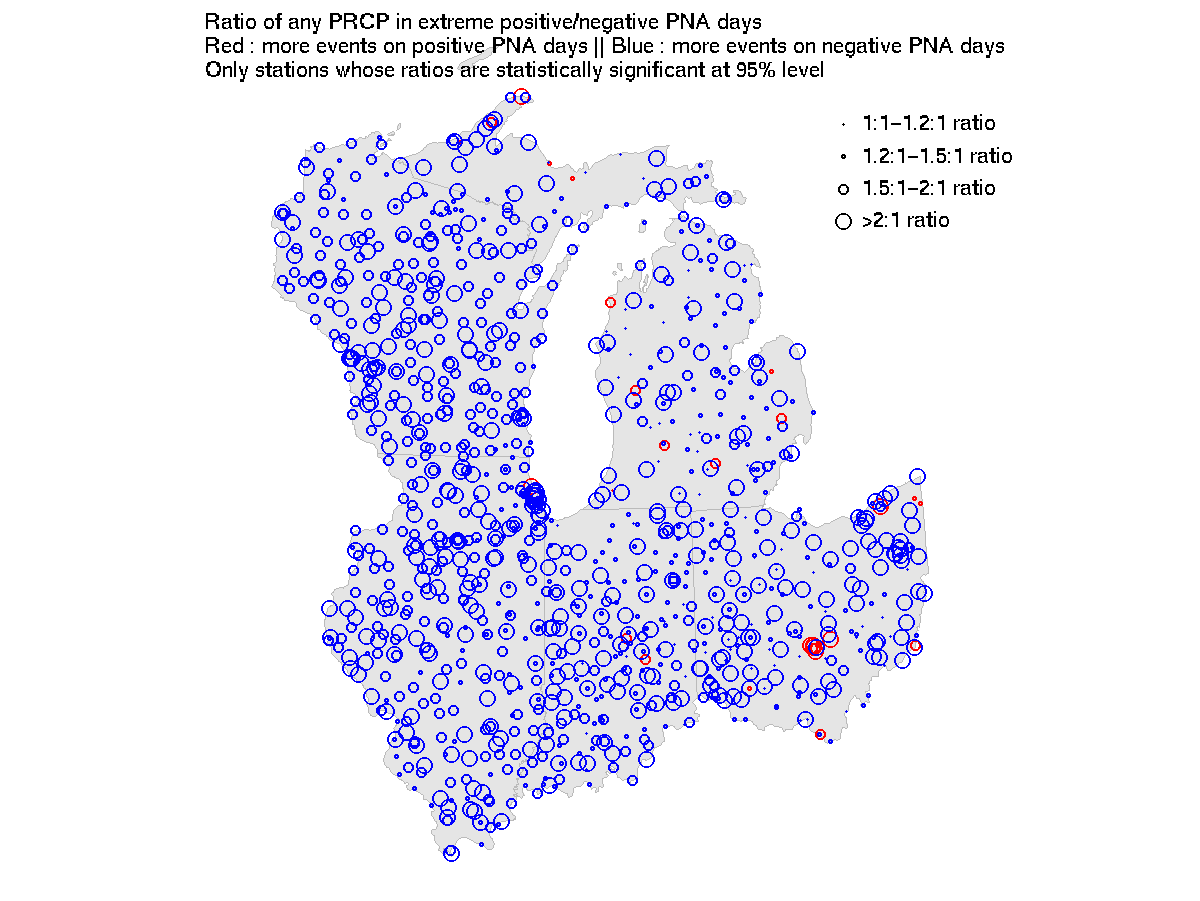
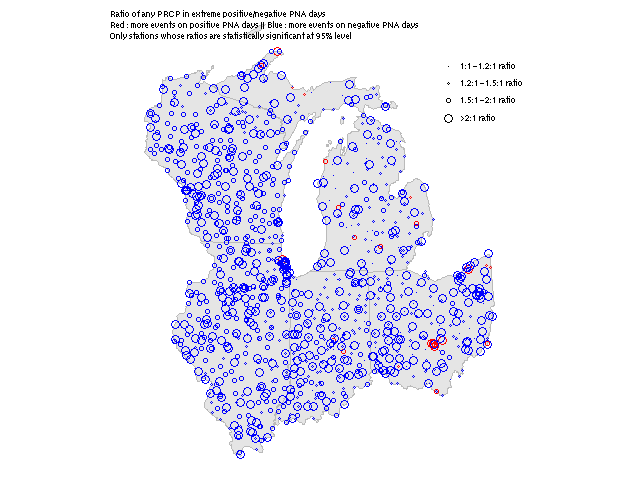
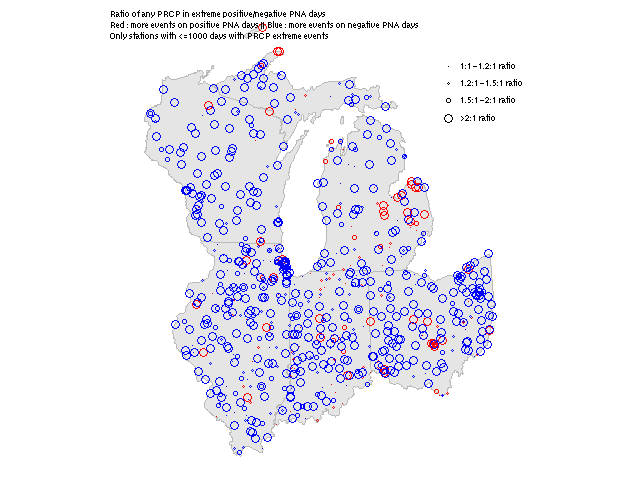
Stations whose PRCP/PNA ratios are statistically significant

PDF | EPS | TIFF (1200x900)
PNG: (2400x1800) | (1200x900) | (640x480)
Open PNG in new window:
(1200x900) | (640x480)

Stations with >=40 extreme any PRCP days

PDF | EPS | TIFF (1200x900)
PNG: (2400x1800) | (1200x900) | (640x480)
Open PNG in new window:
(1200x900) | (640x480)

Stations with >=1000 extreme any PRCP days

PDF | EPS | TIFF (1200x900)
PNG: (2400x1800) | (1200x900) | (640x480)
Open PNG in new window:
(1200x900) | (640x480)

Stations with <=1000 extreme any PRCP days

PDF | EPS | TIFF (1200x900)
PNG: (2400x1800) | (1200x900) | (640x480)
Open PNG in new window:
(1200x900) | (640x480)