![[gif]](img/pdo_enso_comp.gif)
![[jpg]](img/pdo_enso_comp.jpg)
![[png]](img/pdo_enso_comp.png)

Pacific Decadal Oscillation (PDO) Graphics
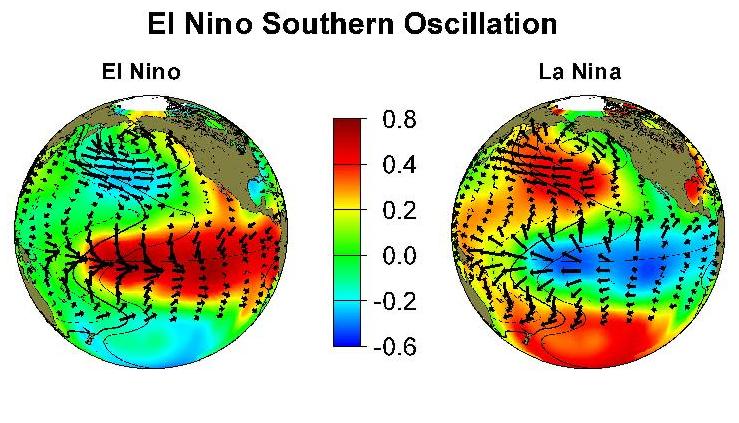
comparison of typical warm PDO/El Nino SST, SLP, and wind anomalies
[postscript] [gif]
[eps]
[jpg]
[pdf]
[png]
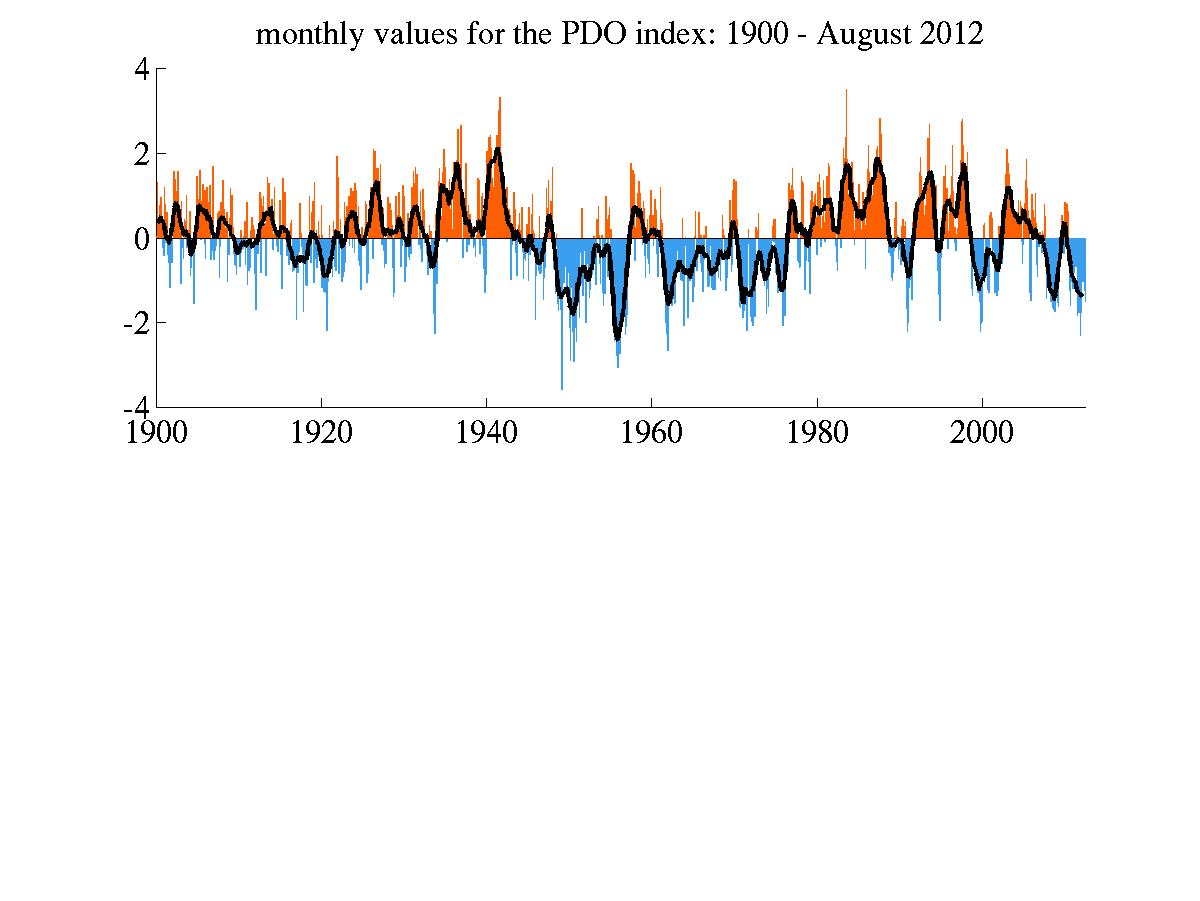
time series of our SST-based monthly PDO index [postscript]
[tiff][png]
[jpeg]
Black and white plots of SST, SLP, and surface windstress regressed
onto the Oct-Mar PDO index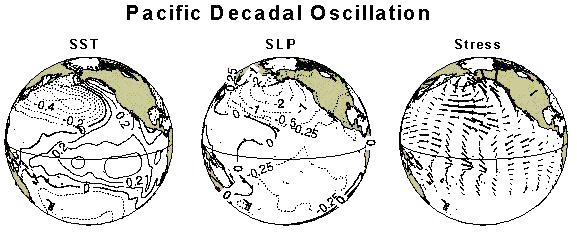
Black and white plots of SST, SLP and surface windstress regressed onto
PDO and NINO3.4 indices
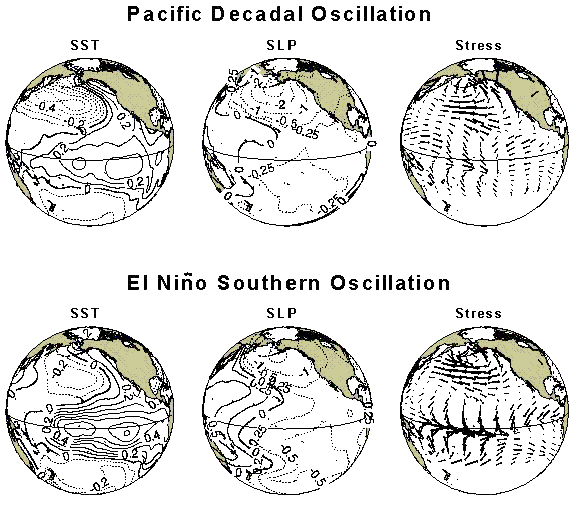
color comparison of warm versus cool phase ENSO SST, SLP, and surface
wind stress anomaly patterns
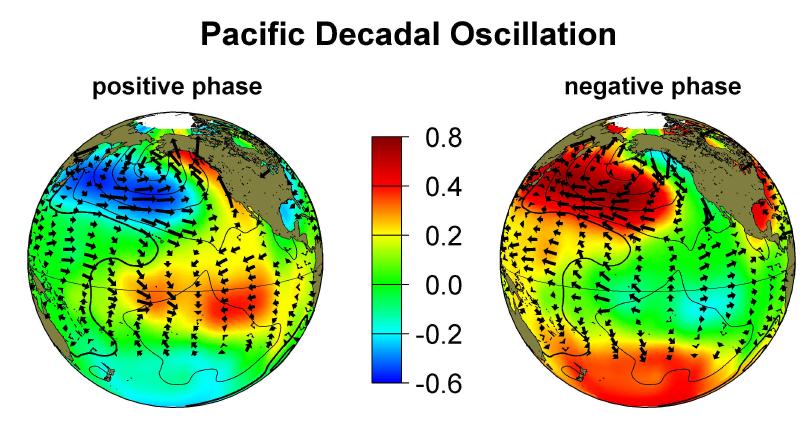
color comparison of warm versus cool phase pdo SST, SLP, and surface
wind stress anomaly patterns [postscript]
[tif]
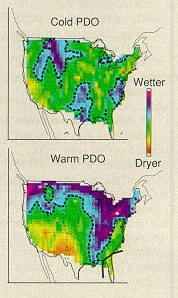
La Nina/PDO combined influences on past US precip, from Gershunov, Barnett,
and Cayan 1999 (EOS)
![[png]](img/pdo_latest.png)