Part I. Trends:
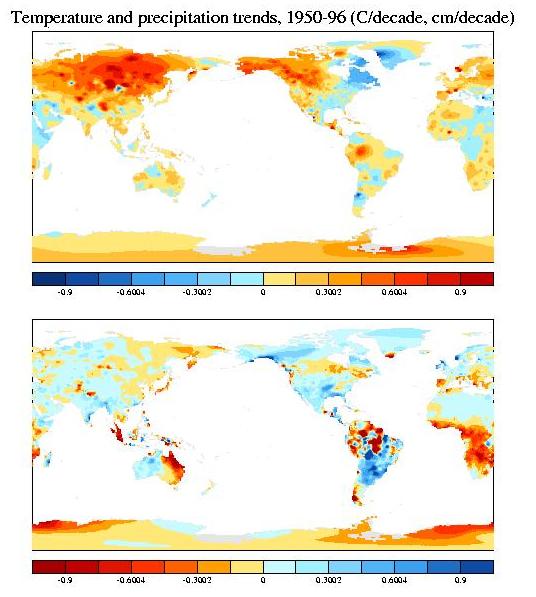
1. November through April
a) Global Temperature and precipitation: PDF
| image | JPEG
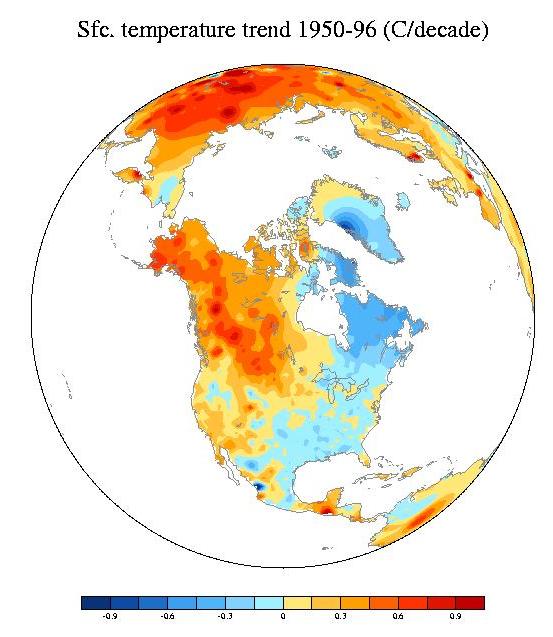
b) "North America"
2. May through October
a) Global Temperature and precipitation: PDF
| image
b) "North America":
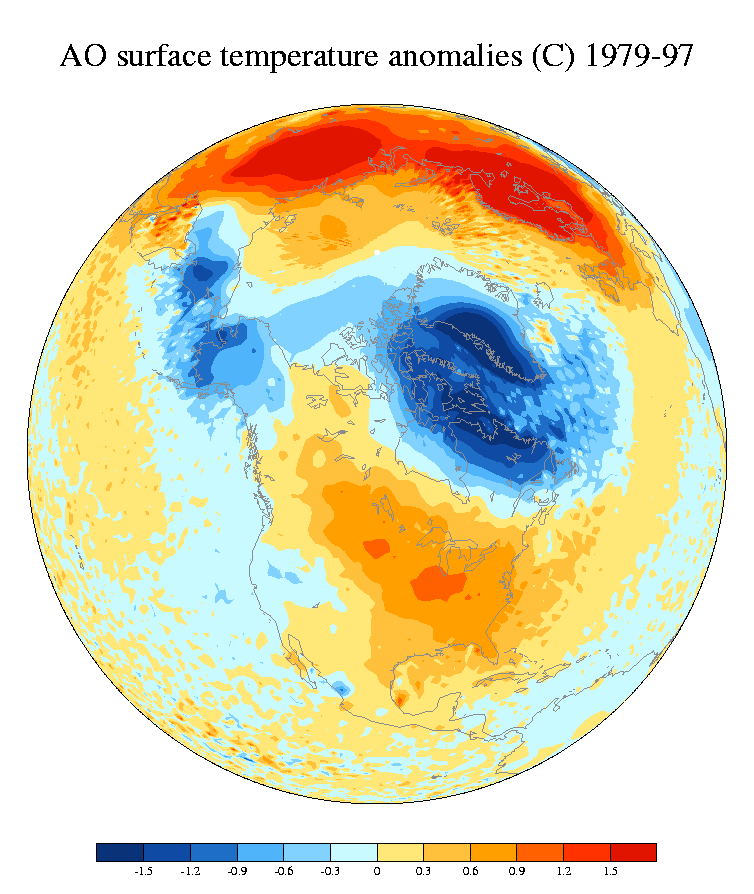
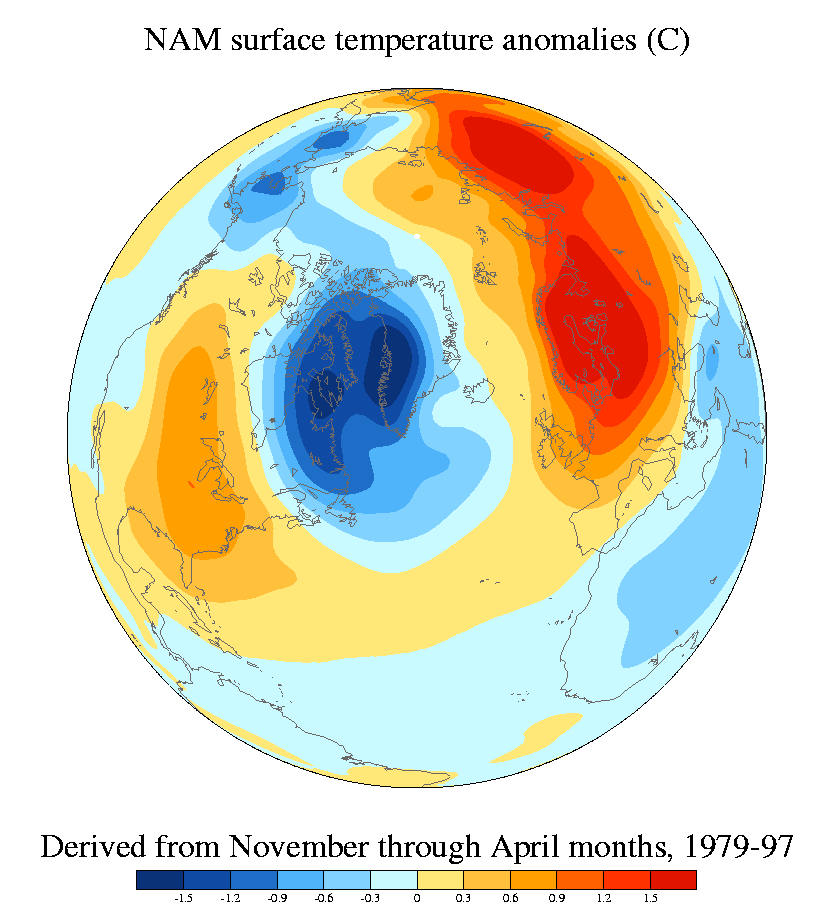
Part II. AO: The sign of the map anomalies is consistent with the "high index" polarity of the AO.
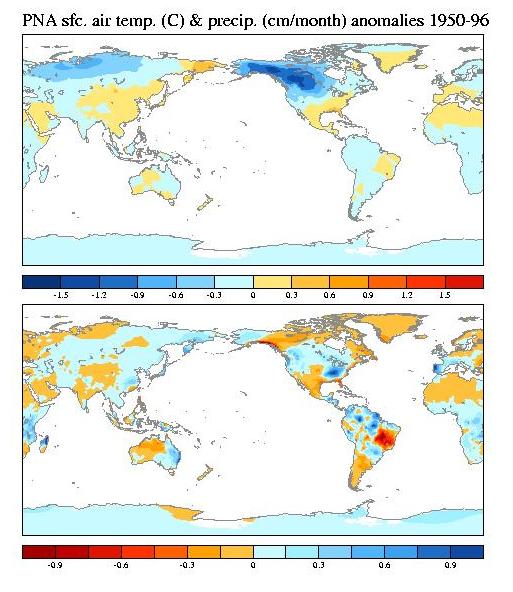
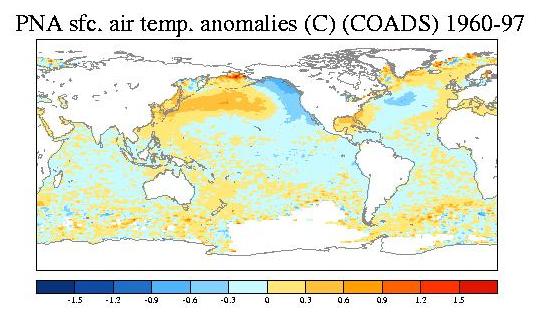
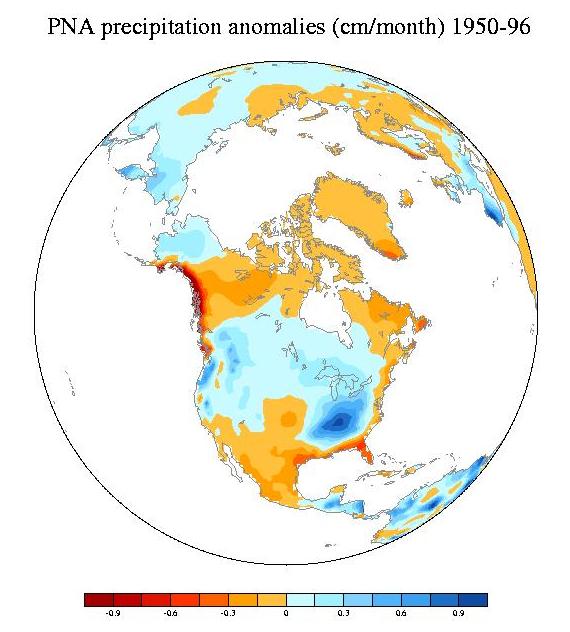
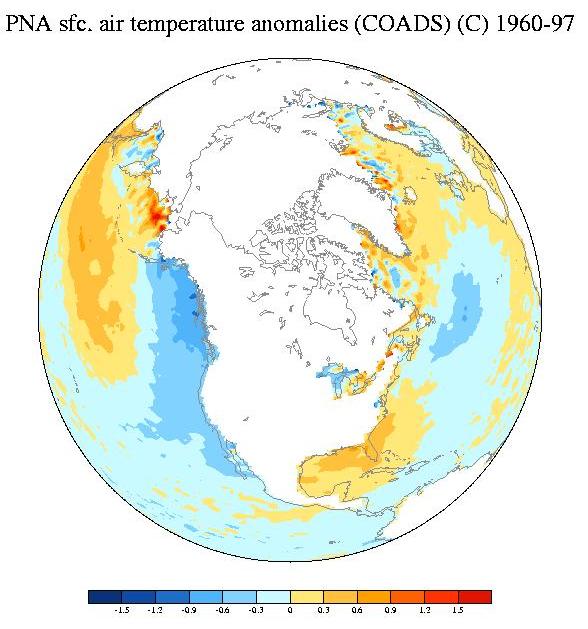
Part III. PNA: The traditional definition of the Pacific North American (PNA) index (Wallace and Gutzler 1981; hereafter WG) is not used for this analysis. Instead, I am using a PNA index defined as the second principal component (PC) of Northern Hemisphere extratropical monthly (all calendar months) sea-level pressure anomalies. The first PC is the AO. PC2 and the WG PNA indices are correlated at 0.73 (0.84) for all calendar months (December,January,February) for 1948-99. By construction PC2 has a slightly broader spatial scale than the WG PNA. The polarity of the following analyses corresponds to a large block and low zonal winds.
Part IV. ENSO: The sign of the map anomalies is consistent with the warm phase of ENSO.
For ENSO I have also calculated regression maps for ocean and land precipitation using a merged satellite - rain gauge data set produced by the Global Precipitation Climatology Project (GPCP). These maps are at this link, and are calculated for all calendar month combined, and for November through April and May through October seasons. The precipitation anomalies in the tropics are much larger than those at high latitudes, and these plots are drawn to highlight the tropical features. NetCDF files of the maps are provided so that you can draw your own pictures.
November through April
a) Global figures
Part V. PDO: The sign of the map anomalies is consistent with the "warm phase" of the PDO.
Part VI. G: The sign of the map anomailes is consistent with the "warm phase" of G (warm tropical Pacific).
There are many analyses and everything is in color. PDF files have been onto an ftp directory ( ftp://ftp.atmos.washington.edu/pub/jisao/mitchell/analyses0500/). [ If using command lines, set the prompt option to off (type "prompt"), and use "mget *".]
The figure titles and filename conventions employed:
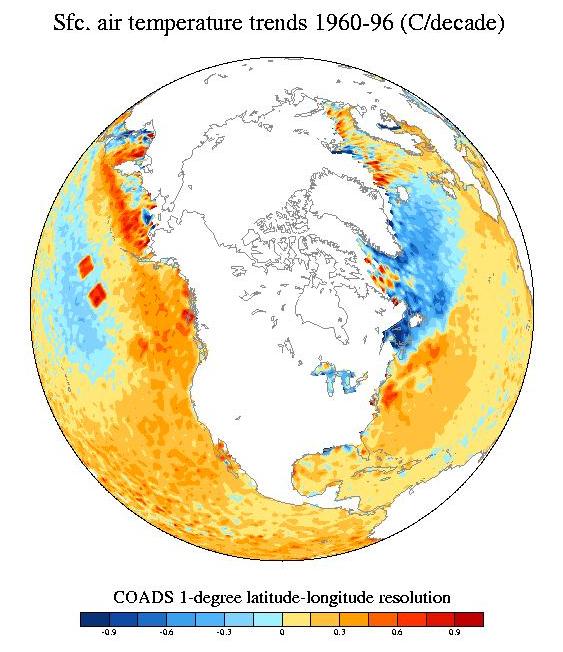
The land temperature and precipitation data are for 1950-96, the COADS data for 1960-96, and the NCEP reanalysis for 1950-96.