big GIF |
JPEG |
PDF |
PNG |
PostScript
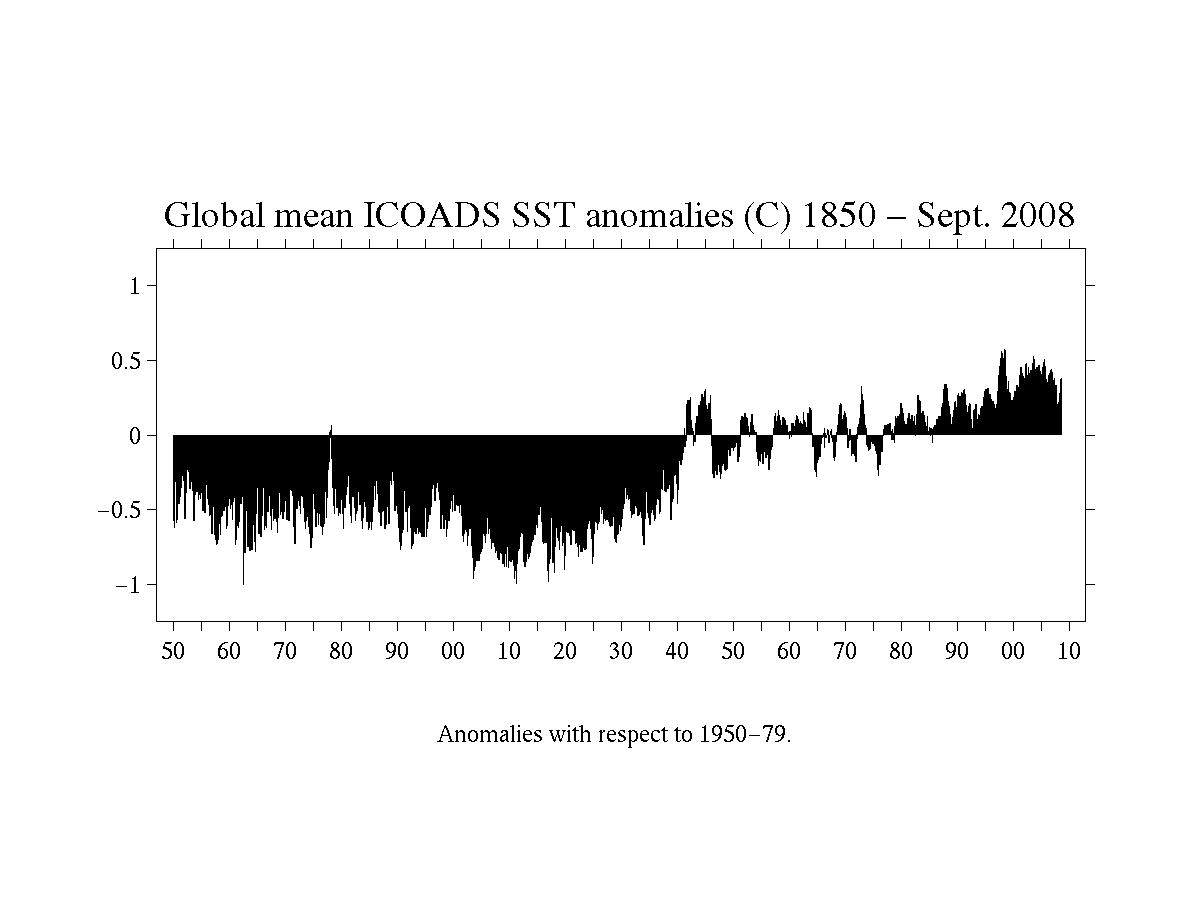
ICOADS (1845 - September 2008) and NCEP (1950-2000)
The two versions exist for historical reasons.
big GIF |
JPEG |
PDF |
PNG |
PostScript
The data is version 2.4 of the International Comprehensive Ocean-Atmosphere Data Set (ICOADS). Anomalies are with respect to a 1950-79 ICOADS SST climatology which has been smoothed with successive 5- and 3-point running means along latitude circles. The contribution of an individual 2-degree latitide-longitude grid box to the global average is weighted by by the area of the grid box.
The data:
Anomalies are with respect to 1950-79.
Reference:
Folland C.K. & Parker D.E. 1995: Correction of instrumental biases in
historical sea surface temperature data.
Quart. J. Roy. Meteor. Soc., 121, 319-367.
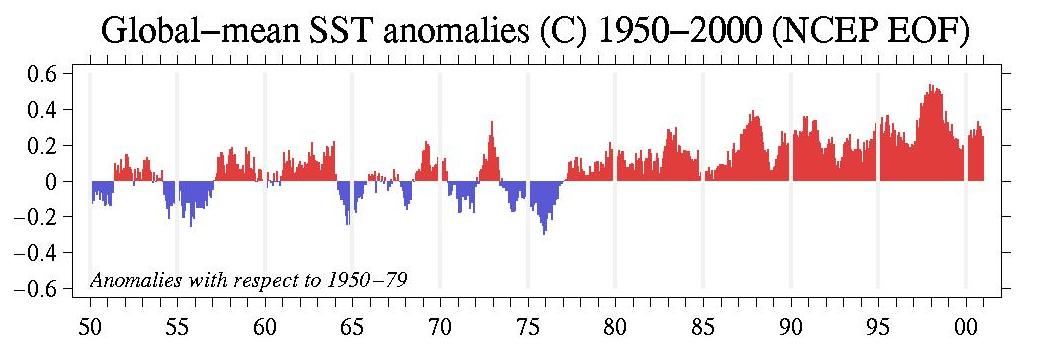
The time series is available for 1950-2000. The
anomalies are with respect to the 1950-79.
The time series is constructed from the NCEP EOF-filtered SST data set (Smith
et al., 1996, J. Climate, 9, 1403-1420). Anomalies are
calculated with respect to a climatology calculated for 1950-79 from
the same data. In an earlier version of this time series, I used a
climatology calculated from the Comprehensive Ocean-Atmosphere Data
Set (COADS). I am providing an all-NCEP analysis now so that it is
simpler
for users to describe the time series. The new and old time series
are very similar: mean(new time series) - mean(old time series) =
0.01C,
and they are correlated at 0.999 for the period of common record. Area weighting is used in calculating
the global mean time series.
Data:
Reference:
PostScript | JPEG
The series captures to some degree the major ENSO warm and
cold episodes as well as the warmer SSTs since the
late-1970s. Temperatures since 1990 have generally been 0.2C above
the climatology.
The time series is provided in 3 formats. The values are the same for
all 3 formats.
Smith, T. M., R. W. Reynolds, R. E. Livezey, and D. C. Stokes, 1996:
Reconstruction of historical sea
surface temperatures using empirical orthogonal functions. J. Climate,
9, 1403-1420.
       JAN  FEB  MAR  APR  MAY  JUN  JUL  AUG  SEP  OCT  NOV  DEC
 1950  -98 -133  -44 -113  -65  -79  -57 -111  -68 -112 -143 -139
 1951  -84 -129 -144  -62  -72  100   57   90   42  121   60   73
 1952   64  150  132   73   63   42  -32   62   12   68   48    7
 1953   62  117  114  132  115   59   50  -14   47   -9   33   15
 1954   16   57   -7  -79 -117 -161 -216 -142 -141 -128 -130 -181
 1955 -122 -112  -57 -145 -211 -172 -126  -93 -127 -259 -206 -218
 1956 -118 -152 -100 -156 -141 -154 -161 -114 -141  -58  -89  -96
 1957  -51    5   20   42  134   92  158  142   86   41   93  143
 1958  176  190  146  151   64   90   32   63   59   86   41  187
 1959  146  164   67   64  132   43   -8   12   64   61   11   40
 1960  -30  -41   50    2  -16  -31   44   -6   51   -6  -30   28
 1961   61  158   96  109  169  116   74  127   44   48   76   94
 1962  108   87   70  101   93   95  160  136  218  143  117  108
 1963   83  105   59   94  158  135  195  189  137  116  193  221
 1964   34   -2  -55  -80 -109 -106 -139 -201 -248 -168 -247 -276
 1965 -219 -163 -181 -121  -97  -90 -101  -74  -23  -26   -3   38
 1966   26   34   33   53  -68   23   42  -10   28  -22   19    0
 1967  -58  -36    6  -21   63   21    4   39   -7  -38  -59  -97
 1968 -144 -163 -132 -109 -112    9  -10   41   54   64   51   97
 1969  165  171  224  203  192   88   54   75   89   95  133  155
 1970  166   97  110  124   54  -13  -84  -81  -59  -24  -25 -102
 1971  -65 -183 -175  -91  -94 -110  -32  -85 -157 -124 -124 -182
 1972  -39   19  -18   54   65   87  146  123  106  214  252  332
 1973  244  190  122  131   59  -32   14  -44  -40  -58  -56 -125
 1974 -158 -179 -174 -170 -116  -98  -61  -56  -97 -104  -94 -135
 1975 -114 -150 -149 -172 -137 -128 -126 -195 -203 -240 -253 -305
 1976 -281 -218 -180 -181 -220 -132 -137 -111 -102  -28  -29  -20
 1977   -9    1    9   43  103  107   52   69  114  131   81   46
 1978  126   64   52   31   32   33   83   41   47   37  105  109
 1979  112   51  105   92   78  166  124  130  215  179  177  184
 1980  203  136  169  149  164  168  115   45   77   29   94  100
 1981   91   60  153  116  126  169  111   35  111  124  122  177
 1982  151   58  107  110  156  127   43   73  128  165  191  230
 1983  290  261  273  225  253  302  161  197  191  153  153  173
 1984  145  168  166  134  123  110  121  122  170   27   47   25
 1985   11   36   56   25   73   39   57    9   60   71   83   92
 1986   66   93   80   88   85  168  112   74  179  208  155  159
 1987  169  160  261  248  290  256  310  324  374  335  396  355
 1988  358  363  349  303  271  216  173  160  176  105   59   60
 1989   75   79  122  140  193  160  278  217  264  197  210  214
 1990  152  262  254  285  256  243  277  271  277  358  347  363
 1991  247  270  274  333  341  341  284  221  207  181  146  185
 1992  179  202  235  212  246  207  127   84  107   68  108  132
 1993  203  214  237  224  261  179  166  100  176  167  233  174
 1994  166  105  217  172  227  184  222  232  125  279  321  329
 1995  302  314  353  268  279  327  367  311  246  265  322  280
 1996  194  254  272  243  225  270  193  208  205  189  176  206
 1997  199  222  336  300  351  434  415  431  481  494  486  538
 1998  502  534  488  501  521  511  502  484  340  320  389  327
 1999  235  277  318  250  234  241  232  182  178  171  197  221
 2000  206  226  256  281  238  290  252  281  332  306  289  251