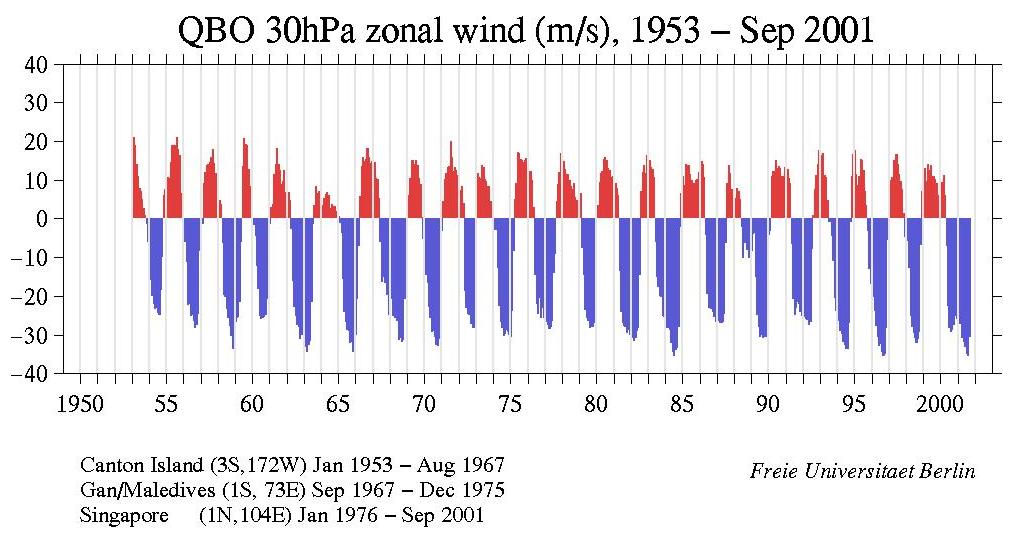
1953 - September 2001
Provided by Barbara Naujokat of the Freie
Universität Berlin.
30 hPa zonal wind (m/s)
PostScript | JPEG
Provided by Barbara Naujokat of the Freie
Universität Berlin.
30 hPa zonal wind (m/s)
PostScript | JPEG
References:
Contact information:
Barbara Naujokat
(naujokat@strat01.met.fu-berlin.de)
Other upper atmosphere time series can be obtained from Jonathan Kinnersley's WWW page.
Digital values
       jan  feb  mar  apr  may  jun  jul  aug  sep  oct  nov  dec
1953   220  210  190  140  110   80   70   50   28   10  -15  -60
1954  -110 -160 -200 -220 -235 -230 -245 -250 -185 -100   60   75
1955   105  108  105  145  190  185  190  211  180  163   66   59
1956   -22  -62 -112 -224 -222 -252 -249 -266 -282 -276 -246  -84
1957   -21  -13   92  120  137  141  147  160  180  144  117  110
1958    60   49   37  -63 -197 -204 -233 -257 -277 -304 -337 -330
1959  -267 -258 -255 -217  -60  135  207  193  190  127   83   40
1960   -02  -18  -46 -124 -182 -252 -260 -256 -255 -249 -208 -155
1961   -13   29   38  114  142  181  140  126   89   98  125   69
1962    55   69   49  -27 -161 -228 -252 -275 -280 -311 -302 -292
1963  -282 -333 -346 -328 -317 -215  -15   36   85   65   70   70
1964    35   20   54   64   68   61   27   37   20   32   15   19
1965    07  -12  -37 -157 -242 -268 -287 -291 -321 -319 -344 -329
1966  -302 -207  -70   57  136  160  148  153  182  160  144  148
1967   148  145  105  101   53  -60 -165 -150 -166 -159 -197 -249
1968  -196 -208 -253 -258 -232 -265 -314 -308 -319 -313 -207 -138
1969    04   61  104  151  151  140  151  138  104   88   03  -54
1970   -96 -147 -166 -229 -258 -294 -290 -306 -327 -329 -312 -189
1971   -32   45  102  118  132  135  200  160  122  134  125  112
1972    95   74   83   40 -187 -231 -246 -250 -273 -269 -284 -172
1973    58  117  106  104  138  132  103   98   85   85   45   10
1974   -14  -29  -31 -129 -225 -267 -282 -304 -298 -288 -292 -300
1975  -305 -240  -85   50   93  171  170  153  152  145  150  157
1976   129  124  123   99   30 -146 -220 -248 -205 -257 -230 -257
1977  -270 -268 -275 -285 -280 -266 -140  -91   44   88  120  170
1978   185  149  128  114  115  100   85   75   93   55   48   20
1979    37   65  -75 -147 -236 -256 -264 -284 -274 -280 -271 -155
1980    27   34   94  117  124  153  159  151  131  125  107  111
1981   101   91   79   60 -136 -241 -269 -278 -281 -295 -289 -302
1982  -302 -310 -316 -310 -291 -283 -145   72  119  137  117  164
1983   157  151  134  128  108  -60 -152 -177 -199 -203 -252 -255
1984  -275 -283 -283 -288 -321 -346 -354 -340 -335 -281  -22   65
1985   110   87  141  137  139  115  100   85   93  100  102  119
1986   152  148  142  106  -42 -194 -232 -229 -234 -241 -254 -267
1987  -260 -266 -271 -270 -268 -247  -63   92  138  117   77   57
1988    54   46   78   70   50  -23 -102  -63  -50  -81 -101  -99
1989   -84  -40  -38 -150 -250 -281 -306 -300 -310 -307 -306 -282
1990   -42  -32  109  124  124  152  131  135  130  109  110  134
1991   114  127  105   92  -67 -209 -250 -231 -215 -222 -242 -253
1992  -253 -254 -260 -262 -275 -268  -79   08   75  112  141  176
1993   155  164  170  112  108   48  -10  -08  -44 -111 -205 -240
1994  -251 -265 -291 -298 -318 -328 -338 -336 -271  -09  109  167
1995   178  115   86  110  155  151  125   72   34  -32 -131 -169
1996  -183 -202 -239 -277 -307 -330 -325 -346 -355 -349 -284  -56
1997    22  100  106  151  151  167  141  114   97   75   15  -49
1998   -50  -57 -127 -253 -280 -297 -308 -321 -311 -292  -68   70
1999    99  131   98  140  126  137  111  110  101   91   47   61
2000    74   95  113   61  -71 -227 -282 -294 -288 -275 -253 -259
2001  -284 -272 -269 -309 -318 -331 -349 -354 -307