PDF | PNG | PS
Data as a 2-column table (year, value in cm/month).
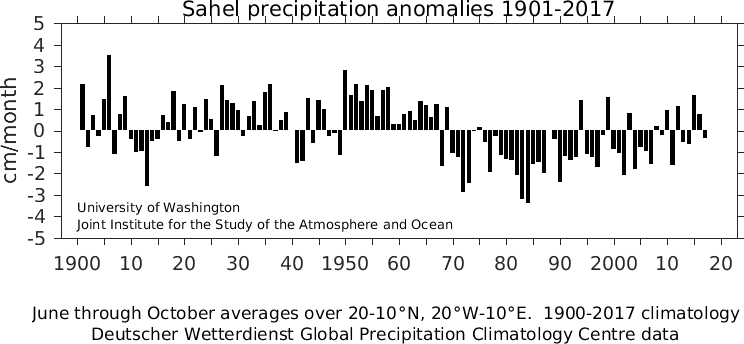
The anomalies are with respect to 1900-2017.
Please use the digital object identifier doi:10.6069/H5MW2F2Q in your citation of this index. Updates of this index are not funded. If updates of this index are crucial to your work, please talk to your funding provider about helping to fund future updates.
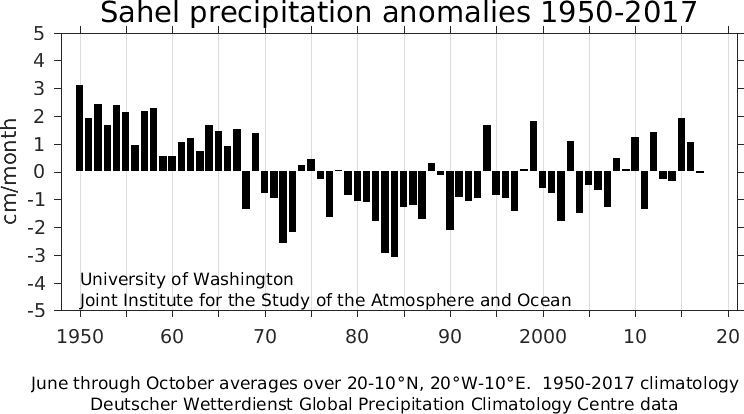
The Sahel rainy season is centered on June through October, and the means are taken for those months. Earlier versions of this WWW page (2008, 2016) provide documentation on the Sahel precipitation climatology and year to year variability. Maps of the climatological African rainfall are also available. Sahel precipitation was above the long-term mean from 1915 through the late 1930s and during the 1950s-1960s, after which it was persistently below the longterm mean, with the largest negative anomalies in the early 1980s.
References:
Janowiak, J. E., 1988: An investigation of interannual rainfall variability in Africa. J. Climate, 1, 240-255.
Publications using the Sahel precipitation index ( doi:10.6069/H5MW2F2Q )
Cherlet, M., C., Hutchinson, J. Reynolds, J. Hill, S. Sommer, and G. von Maltitz (Eds.), 2018, World Atlas of Desertification, Publ. Off. Eur. Un., Luxembourg, doi:10.2760/9205
Finch, T., J. W. Pearce-Higgins, D. I. Leech, and K. L. Evans, 2014: Carry-over effects from passage regions are more important than breeding climate in determining the breeding phenology and performance of three avian migrants of conservation concern. Biodivers. Conserv., 23, 2427-44, doi 10.1007/s10531-014-0731-5
Friedman, A. R., G. Reverdin, M. Khodri, and G. Gastineau, 2007: A new record of Atlantic sea surface salinity from 1896 to 2013 reveals the signatures of climate variability and long-term trends. Geophys. Res. Lett., doi 10.1002/2017GL072582.
Frost, L., Mace, D., P. Wraight, and L. Lewis, 2016: Edexcel A Level Y2 Geography Student Book, 978-1-2921-3964-7.
Goulden, M., R. Few, L. Abebe, N. Brooks, M. Daoud, M. K. Kanaté, E. Sarney, D. Smith, B. Umoh, P. Vernon, J. Weiner, and B. Yamba, 2011: Climate change, water and conflict in the Niger River Basin. International Alert, London and University of East Anglia, Norwich UK, 70pp.
Gray, Nick, 2015: Facing up to global warming. Springer Sci. Bus. Media, 406 pp, doi: 10.1007/978-3-319-20146-7
Haywood, J. M., A. Jones, N. Bellouin, and D. Stephenson, 2013: Asymmetric forcing from stratospheric aerosols impacts Sahelian rainfall. Nature Clim. Change, doi:10.1038/NCLIMATE1857.
Hesse, C., Anderson, S., Cotula, L., Skinner, J. and Toulmin, C. 2013. Managing the Boom and Bust: Supporting climate resilient livelihoods in the Sahel. IIED Issue Paper. IIED, London
Intergovernmental Science-Policy Platform on Biodiversity and Ecosystem Services (IPBES) African Regional Assessment, United Nations, March 2018
Revise Edexcel GCSE (9-1) Geography A Revision Workbook, 2017, ISBN 978-1-2921-3373-7.
Sitch, S. and Drake, F. (2013) The changing water cycle. In Holden,
J. (ed) Water Resources: an integrated approach. Routledge.
Tobolka, M., L. Dylewski, J. T. Wozna, and K. M. Zoinierowicz, 2018:
How weather conditions in non-breeding and breeding grounds affect
the phenology and breeding abilities of white
storks. Sci. Tot. Environ., 636,, 512-8, doi: 10.1016/j.scitotenv.2018.04.253
The precipitation index is provided here in several formats. The
anomalies are with respect to 1980-2009.
Digital values:
       jan  feb  mar  apr  may  jun  jul  aug  sep  oct  nov  dec
 1901   -5   -6   -5  240  115  299  346  607  232  131   60   10
 1902   -4   38   83  227  115   25  330   14 -321  111  -13   27
 1903   25   -6  -10  141  202  -43  142  714   20   69   25    4
 1904   35   -7    2  -16  189  226  436  -27 -241    8   17   11
 1905    1    7   18    8   15  352  227  157  289  258   39   11
 1906   44   25  -19   73  228  123  878 1017  204   80   63  127
 1907    0   -1   11  -27  -28   67 -276  142   83  -33   39   -2
 1908   -5   -8   59  -12   14   27   65  533  299   -2    4   13
 1909    6    4   25  186  298  327  304  525  182   13   29   26
 1910   -5   -5   11  -17    5  -68  242   21  219  -65  -20    3
 1911    0   -8   66   72  223   92  -46   14  -21   -4   22    7
 1912   -2   -4  -18   12 -120  -18 -194  125  116   32   13    5
 1913    5   -6  -16   -1   18 -106 -235 -126 -195  -87   13   78
 1914   -5    1   -4  -60 -107  -81  -49   86  245   96   58   -2
 1915   -5   -7   68  136  185  196  164   18  -30  -17   11   -3
 1916   -5    0   22  121  -14  -95  259  401  421  -88    5    4
 1917    3   13   32  -25  219   -6  -90  255  588   -9   38   58
 1918   19   14   17   49  149  386  199  529  251  101   33    4
 1919   -4   -4   10  -17  140  -12  192 -108  268  -39   19    3
 1920   -4    6  -16    1   25  194  -85  813  318  -79   35   -3
 1921   -5   -2   22   14   76  -11 -104  372   97   -1   71   -1
 1922    3   -5  -10   54  -59  -97  127  383  462  217   48    5
 1923    6   -7    6   94  -24  -59  210  210   72   80   55    5
 1924   23   25   -1    3  -46  221  383  293  417  -34   30   -2
 1925    2   -8   14   -9   34   50   51  274  184  243   17   -4
 1926   -5   -8   -4  -16   30  268   70 -184  -97 -116   26   -2
 1927   -4   -3  -21   55  148  207   10  770  316  300   49    5
 1928    0   -8    7   49   19   -7   46  931   51  236   -4   -2
 1929   -5   -4   12   -7  129  321   91  537  150   77  -11    1
 1930    5    1    9   23  246  131  270  371  152  106  -12    3
 1931   -5   25   -3   39  117  107  311 -387  447  -67   51    3
 1932   13   20   22   -7  148   26  146  480  196   41   11   -3
 1933   11    9    4   33  201  463  346  396   78  -58  118   14
 1934   -5   -8   18    1 -121  104   37  399   99   26   -7   -4
 1935    7   10   25   -3  -32  205  265  745  188   41   11   -2
 1936   -6   12   -9   83  223  211  337  777  249   43   79    8
 1937   -6   -5   -2  -27  -15 -106   91  351  142   44   13   -3
 1938   -5   -7   72  -33   14  -45  202  280  212  128   13   -4
 1939   -5    1   11  -31  121   17   91  444  305  119    8   11
 1940    3   -8   -6  -19   -2   63 -120  333   19  254   -1   -4
 1941    0   -8    1    9   99   44  -19 -192   86 -146   24   -2
 1942    0    7   -6   27  109 -142  -42  251 -284   39   39   16
 1943    1   -1   15    0   56   51   32  648  496   76    8   68
 1944   -5   -6    8    6 -144   16 -172   59  168  173   31    6
 1945   -5   -8  -17   -2    3 -118  198  789  289   86    5   -5
 1946    8   -7    2  -30  -11  -27  257  324  310  180   -4   -2
 1947   -2    3  -22  -54 -121    4  -72  359  212  -83   20    0
 1948   -5    7   -6  161    9  284   69  277 -105  -50  -10   -4
 1949    1   -7   15   14  -48  -46   51  263 -213  -75   24   48
 1950    4    3  -19  -33  -18  -46  276 1045  509  170    2   -2
 1951    2    2   37  -23  119  -40  -29  237  474  720   83   -3
 1952   -4   -6  -13  -35   81  -23  273  355  904  104    0    2
 1953   -2   12   29  -33  278  289  451  188  214   88   21   27
 1954   -5   49   21   60  140  178  594  777   10   43  173   -1
 1955   -2    3   52   35    5  248  524  192  410  101    4   34
 1956   -1    7   24    0  -60   -1  206  317  332   20    9   91
 1957    0   -4    2   14  183  200  215  321  412  338   44    6
 1958   14    1   -2   36   10  256  272  860  165   -5  153    0
 1959   -3   -2   -5  -27   90  -75  -51  771  178 -139   20   -5
 1960   -5   -8    5   18   42   84  362   -8  277  -32   16    8
 1961   -1   -7   -8  -17  -46  143  447  298  177 -128    6   -4
 1962   -5   -7  -10   58   24  115  130  496  128  125   93   -4
 1963   -2   11   -7   57   14    4   48  254   85  385   -9   -5
 1964   -4   -8    6    1   92  206  311  542  269  -91   -7   54
 1965   21    6  -19  -47  -25  242  -10  475  396   26   11   -5
 1966   -6   -8    8   29   33  157 -255   15  538  400   -4   -1
 1967   -5    1   22   17  -45   32  138  430  448  118   16   -2
 1968   -5   57   26  149   72   63   17 -331  -27   -4   15    8
 1969   -3   -6   15   -3  -26    7  309  235  166  382   18   -2
 1970   -4   -8   -9  -35   56 -195  143  141   68 -149    1   -4
 1971   -5    2   20    9  -56 -127  -61  276   -6 -153   -8   14
 1972    1   -2    4   32  102    7 -319 -297 -293   18    4    4
 1973   -5   -5   -9  -12  -14  -81  -76 -143 -243 -139  -11    0
 1974   -5   -7    8  -27  -62 -117  337  277   81  -53    2   -4
 1975   -5   -6    5    0   55  -93  514   28  236  -57    3    0
 1976   12    5   -7    9   83   30 -106 -134   50  425   44   12
 1977    3   -8   -9  -54  -17  -93  -96 -202   59  -88  -24   -2
 1978   -3   -3   31  168   60   67  248 -108  106  105   17    8
 1979   16   -8    2  -30  100  234    0 -190 -102   28   31    2
 1980    1    9  -21  -23   19  -19   40   79 -132  -91   14    4
 1981   -4   -4   12   29  126  -10  222  -99 -143 -112  -15   -4
 1982   -5    4   25   50   -1  -54 -146  -48 -291   51  -13   -4
 1983   -5   -2  -10  -41   -2   15 -249 -406 -234 -190  -17   -4
 1984   -5   -8    5   -5   78  -42 -256 -702  -97  -51   21   -4
 1985   -4   -7   14  -45 -113  -32   19  -46  -38 -148  -10    0
 1986   -5   -3  -11  -23    9  -97  -71 -272  291  -53   -7   -4
 1987   -5   -7   -1  -76  -86   -8 -214 -206  -42   10  -19   -4
 1988   -4   -2  -12   33 -106   37  100  381  171 -134    4   -4
 1989   -5   -1   14  -49  -86   43   21  369 -128   38  -11    9
 1990    0   -6  -23  -11   19 -133   82 -330 -199  -80   -6    3
 1991   -4    4   18   29  258  -29   97   75 -320  125  -20   -2
 1992   30   12   -8    4  170  -21   71  -62  -71  -54   49   -3
 1993   -4    7   69    5  -71    2  149 -142  -32  -60   32   -3
 1994   -6   -4   -1   -9  -16    8   49  409  446  332   19   -4
 1995   -6   -4   11   41  -10  -67  -21  116   -7  -39   -8   56
 1996   -3    1  -10  -18   49  -10  -50 -107   88    7  -12    0
 1997   -1   -8   12   38   90  138 -243 -172  -46   14   -7   -5
 1998   -2   -4  -22   28    6  -31 -110  116  492  -31  -20   -1
 1999   -4   -3  -11   12  -69 -115  215  629  327  257    6   -3
 2000   12   -7  -11  -17  -19   32  204 -113 -155  141   -5   -4
 2001   -6   -8  -18   38  -61  146  116 -102  -44 -108   17   -4
 2002   51   -3   -4  -20  -95 -109 -217 -287  -69  195  -18    2
 2003    0    0    3   23  -32  200  178  324  134  113   21   -3
 2004    5   -1   -8   37  -32   -1   90  -55 -253 -136    7   -2
 2005   -2   29   24  -17   30  172   43  -92   66  -25  -12   -3
 2006   -3   18  -16   -2    3  -69 -107   68  154   28  -23   -4
 2007   -5   -6  -10   29  -50 -147  -33  281 -209 -126   40   -1
 2008   -5   -2   -5   -7   16  201  172  178   23   73  -17   -2
 2009   -5    7   -4  -33  -23    0 -148  216  319   55   11   -3
 2010   -5   -2  -12    7   88  144  123   61  477  211   -8   -3
 2011   -4    3   -4  -27  -37  -38 -153  174 -160  -91  -17   -3
 2012   -5    8   -6   10   72   41  413  400  266   -3   42   -2
 2013   -3    8    5   90  -75  -56 -152  389   76   15   -6    0
 2014    9    3    0    2  346   53 -214  184  179   29   16   -2
 2015   -4   12    1  -52  -90 -101  371  567  378  153   16   -3
 2016    7   -7   23   38   70   86  411  178  335  -83    1   -3
 2017   -4   -7   -2   14  207  333  203  192 -223 -130   -5   11


JJASO-means in 0.1 mm/month with respect to 1901-2016, so "215" is
2.15 cm/month.


        +0    1    2    3    4    5    6    7    8    9
 1900       215  -77   72  -28  148  352 -112   76  162
 1910  -39 -102  -96 -258  -49  -42   71   39  185  -48
 1920  124  -38  110   -6  148   52 -120  212  143  127
 1930   98  -26   69  136   25  180  215   -4   47   87
 1940    1 -154 -144  152  -59  140  100  -25  -13 -112
 1950  282  164  214  137  212  187   67  189  201   28
 1960   28   79   90   47  139  117   62  125 -165  111
 1970 -107 -123 -285 -245   -4   17  -55 -192  -25 -115
 1980 -133 -137 -206 -321 -338 -157 -149 -200    2  -40
 1990 -241 -119 -136 -125  140 -112 -123 -170  -21  154
 2000  -87 -107 -206   81 -180  -76  -94 -155   21  -20
 2010   95 -162  115  -54  -62  165   77  -34
February 2018
Todd Mitchell ( mitchell@atmos.washington.edu
)
JISAO data