analyses | digital values | applications
Big GIF | PDF | PNG | PS
analyses | digital values | applications
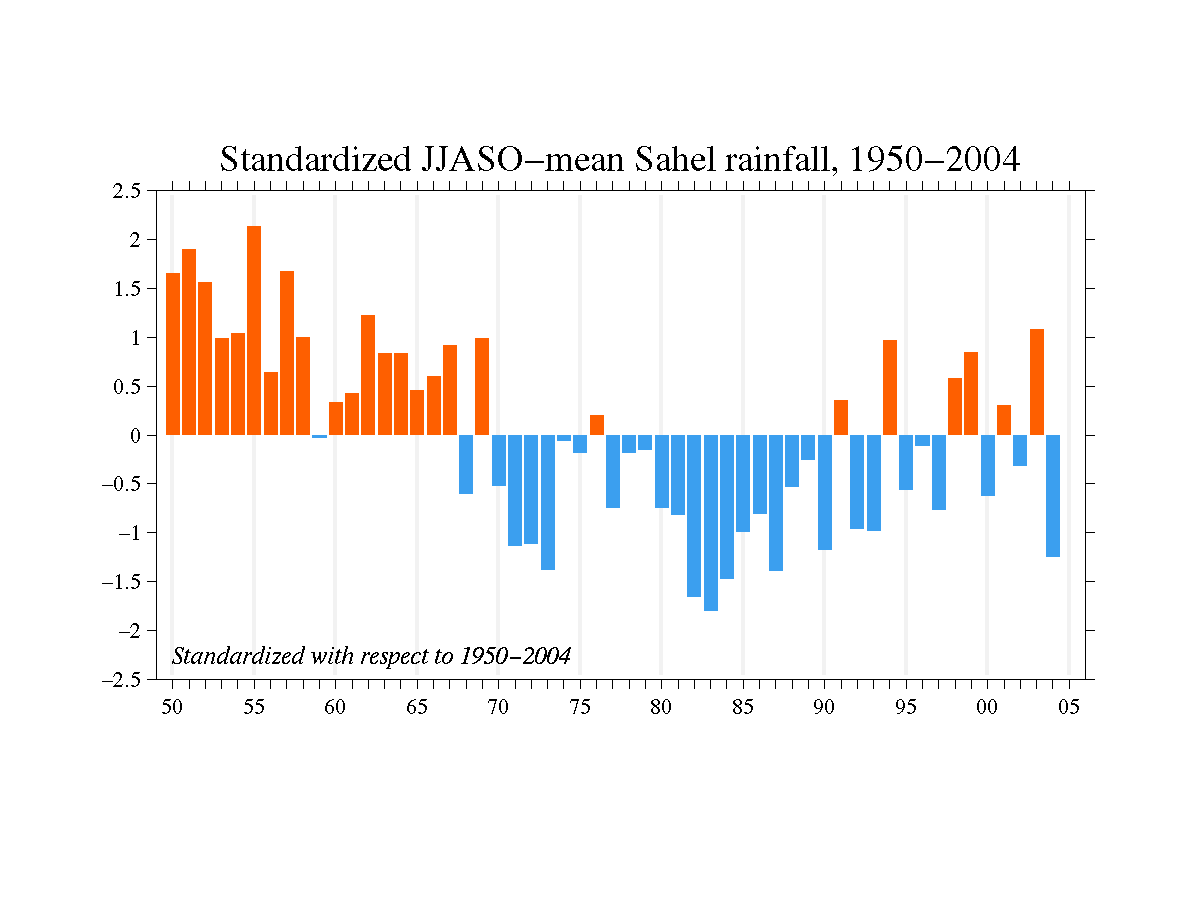
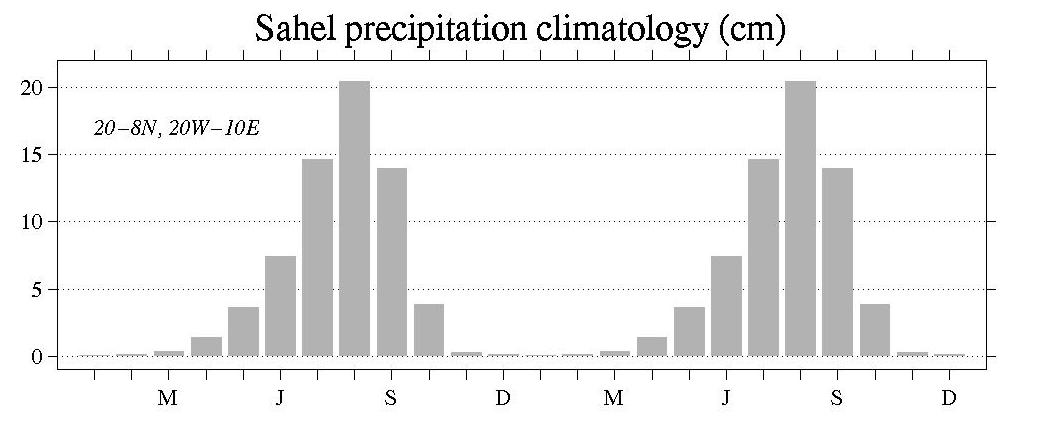
The averaging region is based on the rotated principal component analysis of average June through September African rainfall in Janowiak (1988). Stations within 20-8N, 20W-10E are obtained from the National Center for Atmospheric Research World Monthly Surface Station Climatology (WMSSC), and 14 were chosen which had complete or almost complete records for 1950-93. The stations are listed below. [I created this index in 1996. As of 2001 there are more than 70 stations in the WMSSC with long records that could be used in this index. For this update, I used only the original 14 stations, and for 2000-present the index is only based on 9-11 stations.]
                                                                  annual total
           WMO*    Station                   location       years   rain (cm)
 1 610360 TILLABERY   Niger       (14.2N,  1.5E)   1951-2002  43
 2 610430 TAHOUA      Niger       (14.9N,  5.3E)   1921-2002  38
 3 610800 MARADI      Niger       (13.5N,  7.1E)   1932-2002  53
 4 612260 GAO         Mali        (16.3N,  0.1W)   1919-2002  23
 5 612700 KITA        Mali        (13.1N,  9.5W)   1931-2002 103
 6 612720 SEGOU       Mali        (13.4N,  6.2W)   1907-2002  69
 7 612930 KOUTIALA    Mali        (12.4N,  5.5W)   1921-2002  99
 8 614980 KIFFA       Mauritania  (16.6N, 11.4W)   1922-98    30
 9 616410 DAKAR       Senegal     (14.7N, 17.5W)   1898-2002  47
10 616540 THIES       Senegal     (14.8N, 17.0W)   1918-73    65
11 616660 DIOURBEL    Senegal     (14.8N, 16.3W)   1919-99    60
12 653060 KANDI       Benin       (11.1N,  2.9E)   1921-2002 103
13 653190 NATITINGUE  Benin       (10.3N,  1.4E)   1921-2002 129
14 655020 OUGIHOUA    Upper Volta (13.6N,  2.4W)   1920-2002  65

* World Meteorological Organization
Sampling plots: PostScript |
JPEG | PNG
The monthly rainfall totals for these stations are provided here as a 16-column table. The columns are year, month, Tillabery, Tahoua, ... The rainfall is in 0.1 mm, I have set the trace and missing observations to 0.1 mm and NaN, respectively.
Maps of climatological Africa rainfall are also available.
The individual time series are standardized for each calendar month with respect to the years 1950-93. The index value is taken as the mean of the available stations for each year and month. The final index is standardized by calendar month with respect to 1898-1993.
Additional information on African rainfall variability can be
obtained from:
Reference:
Janowiak, J. E., 1988: An investigation of interannual rainfall
variability in Africa. J. Climate, 1, 240-255.
Digital values:
The timeseries is standardized separately for each calendar month with respect to 1898-1993. Values are given for all calendar months even though it is extremely rare if not unheard of for it to rain during the months November through February. The use of normalized values in the index exacerbates the errors in these months. Index values for these calendar months should be used with great care if not ignored altogether.
The rainfall index is provided in several formats.
       jan  feb  mar  apr  may  jun  jul  aug  sep  oct  nov  dec
 1898  -13  -47  -13  -30  -34   62 -107   62 -102  -98  -19  -24
 1899  -12  -47  -13  656  -34  250   60  -48  -77  177  -19   70
 1900  -13  174  -13  -30  -34   -4   65 -131  213  -43  -19  -24
 1901  -13  -47  -13  -30  -34  250   72  -99   31 -105  -11  -24
 1902  -13  -47  -13  -30  829  -70  -42  -24  -47   65  -19  -24
 1903  -13  -47  -13  -30  -34  -32 -182  107  -67 -105  -19  -24
 1904  -13  -47  -13  -30  -34  -51    5  183 -126 -103   38  147
 1905  -13  273  967  -30  -34   52   23   -5 -173  304  -19   18
 1906  -13  -47  -13  -30    5   43  296  354   -4  -45  -15  840
 1907  -12  -35  -13  -54  -69  134   15 -108  176  -16  -14  -24
 1908  -13  -35  -13  -50  -55   12   -5   82  -10  -10  -19   65
 1909  -13  -35  -13    7   -1  105  226   79  -30   59  -19  -24
 1910  -13  -35  -13  -54  -17 -103   47  -86  -86 -104  -19  -24
 1911  -13  -35  -13  -38  216  -54   -1  -79  -88  -68  -17  -24
 1912  -13  -35  -13  -27  -49  -30  -49   29 -105  -76  -19  -24
 1913   -8  -35  -13  -54  -63   10  -79  -35 -136  -99  -19  -24
 1914  -13  -35  -13  -54  -11   45  -54  -12  -82   43    6  -24
 1915  -13  -47  -13  -30  -34  -80  513  338  -24  -78  -19  -24
 1916  -13   27  -13  -30  -34   99  -45  -83  -85  -80  -19  -24
 1917  -13  -47  -13  -30  -34  476 -127  171  272 -110  -19  -24
 1918  -12  -41  -13  -35  -42  162  -59  182   62  178  -19  -27
 1919  -14  -42  -12  -34   24   -4   97 -139  -31  -56  -19  -29
 1920  -14   -1  -12  -42   -7  -44  -24   64   26  -15  -18  -27
 1921  -12  -36  -11  -17  -26  -50 -139  -47   31   11  956  -28
 1922    6  -16  -12    8  -36  -56   13   -1   87   25   -7  -20
 1923    3  -40  -10   75  -32  -64  -10   48  -47  -11  -18  -23
 1924   21  630  -10    2   76   69   67   38   74  -86   -9  -24
 1925   -8  -40  -11  -52  -15  -61  -18   -9  -45  102  -14  -29
 1926  -14  -39  -13  -53   -8   12   -6  -93 -101  -99  -12  -29
 1927  -13  -11  -13   39   67  172 -102  174   40  126   -4  -13
 1928  -13  -35  -11   74  -36  -51  -59  109  -79   75  -18  -29
 1929   -9  -38   -3  -26  -17  174  -60   37  -32    0  -16    3
 1930   11  -42  -13   12   19  -33   13   41   73  -67   -5  -29
 1931  -14   62  -12  222  -13  -47   -5 -118   44  -86  -14  -11
 1932  964   20  -12  -56   43  -39   17  -20    6   51  -17  -29
 1933  -11  -38  -12  -10   68  209  109   57  -23  -58   42  -29
 1934  -13  -41   -8  -35  -74   -4  -18   -2  -23  -13  -14  -29
 1935   80   19   -6  -28  -52   87  118  130  -32   37  -11  -29
 1936  -14  -15  -12   57   71   73   84  126    9  -18   24  -29
 1937  -13  -40  -12  -62   48  -86   18  -50   -5   -2   -8  -29
 1938  -13  -40   55  -41  -33  -99   44  -45   16   16   93  -29
 1939  -13   -3   -5  -55   11 -101  -12   55  107  120  -16  -26
 1940   -8  -40  -11  -31   -5   45  -73    8   -3  144  -16  -28
 1941  -13  -37  -10  -41   23  -70  -21 -145   12  -89   -4  -26
 1942  -13   23  -13   20   22 -128  -57    6 -152  -29   11   52
 1943  -13   46  -11  -31   66  -28  -61   79  142   30  -19  322
 1944  -14  -41  -12  519  -81  -74  -81   -1   75   74  -18  -22
 1945  -13  -39  -13  -38  -14  -96   68   19  155   23  -14  -30
 1946  -11  -39  -11  -44  -77  -57   24    8   79  151  -19  -30
 1947  -13    8  -13  -39  -66  -78  -55   -4   69  -46    3  -29
 1948  -13  -19  -12   78   40  209   20   22 -109  -89   -9  -29
 1949  -13  -35  -10   17  -68  -81   -5    2 -141  -54   -1   59
 1950   -8  -31  -13  -15  -32  -59   59  189  138   97  -14  -18
 1951  -10  -33   -4  -52   93  -70  -12   15  203  360   12  -28
 1952  -13  -38  -13   71   31  -50   30   64  288   66  -19  -26
 1953  -13  -34   -8  -56   56  115  126  -18   50  -38  -16  -14
 1954  -12  362   -7   48  -26   28  117  107  -20   15   35  -29
 1955   -8   39   -8   13    1   71  158   18  144  173  -16    2
 1956  -11   81  -11  -26  -51  -49   78   28   50   26  -15   67
 1957  -12  -39   -9   -7  116   83   56   17  110  164   -7   -1
 1958  -10  -38  -12  -29  -41   45   21  150   43  -21   14  -27
 1959   -6   76  -11  -20   25  -68  -32   61   61  -82  -14  -29
 1960  -13  -39  -10  -50  -13   -6   86  -43   59  -50  -11    8
 1961   -8  -42  -12  -55  -39   31   87   12   55 -116  -20  -29
 1962  -14  -24  -12   71  -34   34   72   78   35   81   19  -28
 1963  -13   45  -13   42  -21  -38  -16   29  -19  232  -19  -29
 1964   -9  -39   -9   44   14   36   88   88   24  -45  -13  213
 1965    2   30  -13  -33  -16  113  -78    6   84  -45  -20  -29
 1966  -13  -40  -11  -28  -40  -18 -146  -57  165  176  -18  -14
 1967  -13  -10   -7  -19  -55  -57    0   44  240  -13  -17   -4
 1968  -13  337  -10  157   -9   -9  -24 -126  -17  -48  -16  -29
 1969  -13  -37  -12  -20  -51  -54  132  -16   13  160  -10  -29
 1970  -13  -40  -11  -17  -29 -123    1  -17   40 -101  -18  -29
 1971  -13  -20   -6  -35  -41  -96  -20  -65  -92 -104  -18   -8
 1972   -9  -38  -13  -15    7   63 -150 -166 -129   10   15    9
 1973  -13  -40  -13  -37  -54  -60  -92  -81 -127  -90  -19  -29
 1974  -13  -41  -12  -33  -26  -76   41    8    8  -51  -19  -28
 1975  -13  -33  -10  -39   14  -54   63    5  -44  -76  -11  -27
 1976  -13  -34  -12  -39   62  -38  -81 -123   10  240  -13  -20
 1977   -6  -41  -11  -40  -39  -80  -16  -77   -4  -91  -16   -6
 1978  -13  -40   -1  179    2 -103  124 -110  -23    6   -7  -17
 1979   -5  -42  -11  -29   11  195  -60 -156  -51  -23  -10  -27
 1980  -13  -39  -13  -38  -77  -12  -91  -12 -101  -50  -17  -30
 1981  -13  -46   -9   10   81  -37  -57  -78  -58  -56  -19  -29
 1982  -13  191   -8   12  -46  -99 -130 -107 -186   -5  -19  -29
 1983  -13  -43  -11  -43  -48  -35 -110 -159 -160 -106  -17  -28
 1984  -13  -41   -9  -22   79  -91 -141 -177    3  -69  -17   23
 1985  -13   -5   -7  -47  -77   23  -53  -89 -108 -111  -18   15
 1986  -13  -37   -9   59   63  -96 -140 -124   92  -17  -12  -29
 1987  -13  -34  -10  -57  -51  -67 -158 -110  -59  -59  -18  -29
 1988  -13  -13  -13    8  -50 -104  -54  -10   52  -90  -19  -28
 1989  -13  -41   -6  -37  -51  -17  -54   44  -80  -17  -17   40
 1990  -12  -41  -10  -17  -30  -63  -61 -118  -90  -60  -17  -28
 1991  -13   51  -10  -41  108   -4   82   15 -150  110  -22  -34
 1992   -5  192  -13  -24   52  -77  -23  -64  -97  -67    0  -27
 1993  -13  -22   -9  -50  -88   -4  -79 -100  -87  -66  -18   -1
 1994  -13   96   -7  -32  -18  -83  -16   58   95  173  -18  -20
 1995  -13  -45   -1   58  -20  -88  -53   38  -68  -43  -19   88
 1996  -13  -40  -13   -7   29   13  -94  -96   56   36  -19  -29
 1997  -11  -41  132   -8  -11   50  -91  -79 -107  -46   -5  -29
 1998   34 2468  -13  -30   42   47 -119   -8  174   23  -19  -28
 1999  -13  -40  172  -43   17 -107   21   71  135   74 1175  -29
 2000  -12  -36  -13  -29  -21  -10    4  -82 -151    6  -21  -29
 2001  -13  -45  -10  -48  758  -27   52  -47  161 -103  -13  -28
 2002   81  -47   54  -48  -49  -97  -49 -104  -62  169  -17   -8
 2003   53  -44   -3    9  -32  121  -10    9   -4  145  -12  -29
 2004   -5   44  -13  -11   48  -11  -79  -57 -167  -97   24 3741
The number of gauges contributing in the last few years:
       jan  feb  mar  apr  may  jun  jul  aug  sep  oct  nov  dec
 1990   13   11   13   13    9    9    9   11   13   13   12   10
 1991   12   10   12    9   12   11    2    5   11    6    2    2
 1992    9    7    7    7   11   11    9   10   12   10   11    8
 1993    9   11   13   11   11    9    9   11   12   11    7   11
 1994   13   10    5   10   12   11   13   13   10   13   12   12
 1995   13    6   10   12   13   11   11   12   11   13   13   12
 1996   13   11   13   10   12   11   11   12   13   11   12   11
 1997   11   11   12   13   12   10    4    9   12    8    9    9
 1998   11   11   10   10    9    8   10   11   13   12    8    9
 1999   12   12   10    9   11   10    9   10   10    8    8    9
 2000    6    9    9    8    7   10    9    8   10   11    3   10
 2001    9    8   10    9    3   11    7    9    9    9   10   10
 2002    4    6   12    9   10    9    9    7    9    9    9    9
 2003    8    6    5    6   10   10    6   11   10    9   11    6
 2004    1    8    7    8    3    4    9    9    6    6    5    4

Standardized JJASO-averages * 100.  -64 is -0.64 standard deviations for 1898.
Standardization with respect to 1898-1993.

        +0    1    2    3    4    5    6    7    8    9
 1890                                          -64  126
 1900   35   52  -41  -97  -32   70  224   70   24  153
 1910 -115 -101  -80 -118  -21  233  -68  238  183  -46
 1920    3  -67   24  -29   57  -11 -100  143   -2   42
 1930   10  -74    5  102  -21  119   95  -44  -24   59
 1940   42 -110 -126   57   -2   59   71  -40   18  -98
 1950  148  173  139   82   86  196   47  150   83  -21
 1960   16   25  105   66   66   28   42   74  -78   82
 1970  -70 -132 -130 -157  -25  -37    3  -93  -37  -33
 1980  -93 -100 -184 -199 -166 -118  -99 -158  -72  -43
 1990 -136   18 -114 -117   79  -75  -29  -95   41   67
 2000  -81   13  -49   91 -143