| Latitude 35° 53´N |
Longitude 83° 57´W |
Elevation 253 meters |
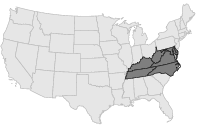
 COOP Mid-Atlantic |
 Tennessee |
Help Main |
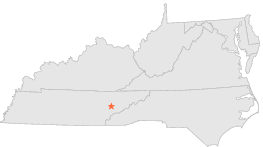
| 1 mi | E : | U S COTTON FIELD STN, TN |
| 2 mi | S : | BLOUNT COUNTY EXP STN, TN |
| 2 mi | S : | LAKEMONT, TN |
| 5 mi | N : | UNIV OF TENN FARM, TN |
| 5 mi | N : | UNIV OF TENN LYSIMETER PLOT, TN |
| 5 mi | NNE : | KNOXVILLE UNIV OF TENN, TN |
| 5 mi | SSW : | KNOXVILLE MC GHEE TYSON ARPT, TN |
| 6 mi | S : | ALCOA, TN |
| 6 mi | NNE : | KNOXVILLE, TN |
| 7 mi | NNE : | KNOXVILLE GARAGE, TN |