PostScript | JPEG
22 February 2002.
The observing system figure is made up of 3 panels. Please do not change the size of the panels. The 3 panels follow.
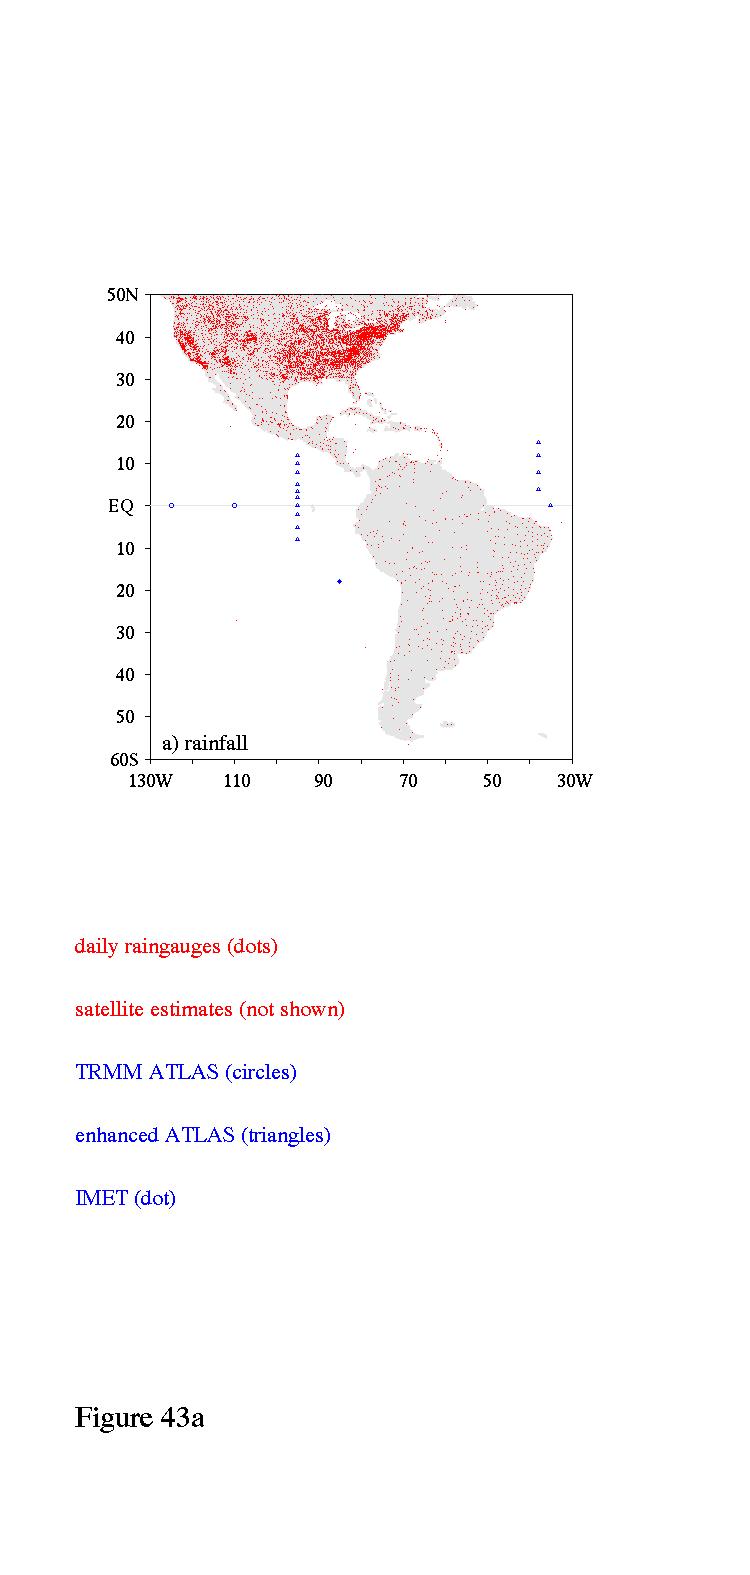
Panel a: rainfall measurements
PostScript | JPEG
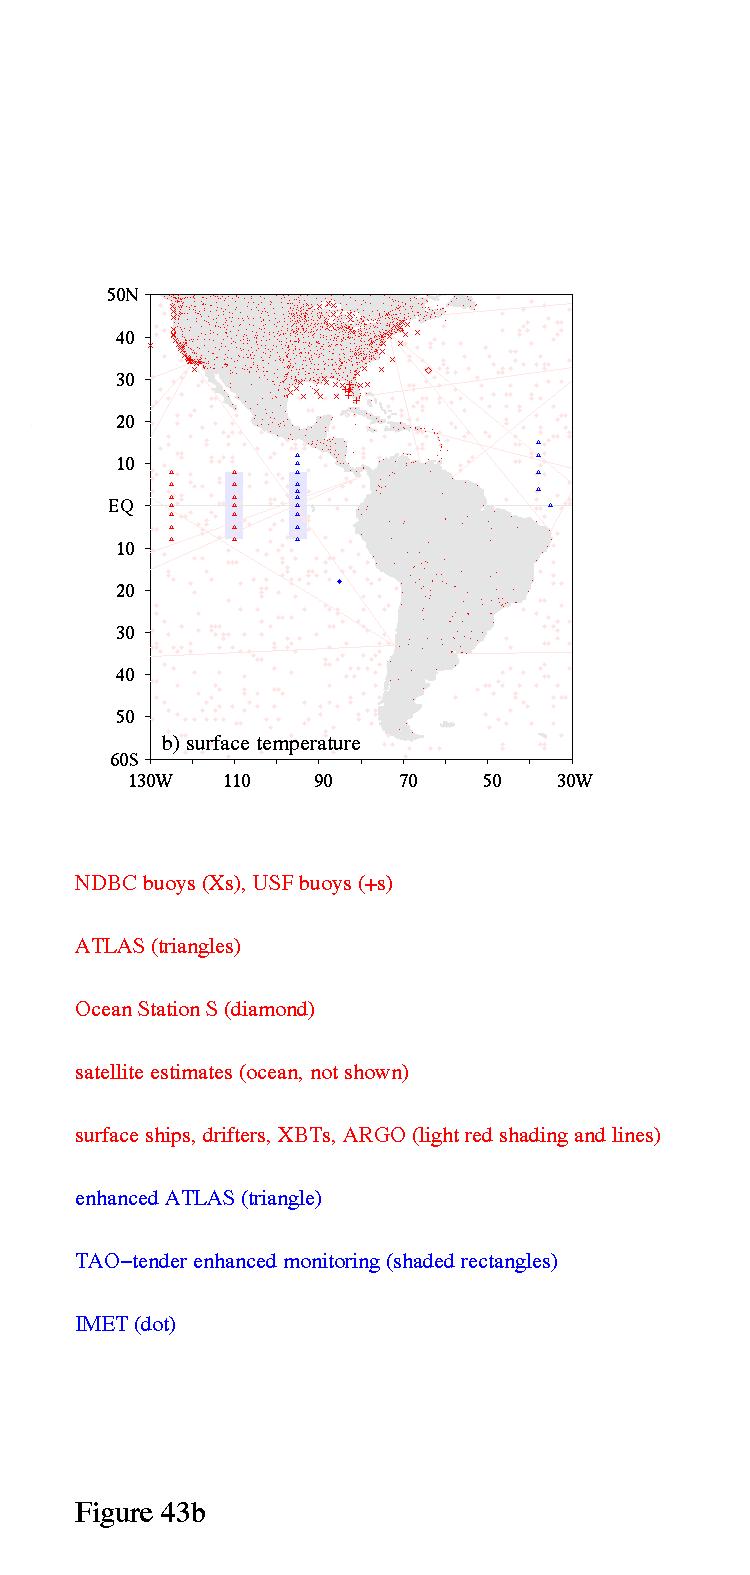
Panel b: surface temperature measurements
Panel b is constructed from the following two figures by reading them
both into Photoshop and overlaying the plot with dots onto the plot
with shading.
The following map is land temperature observations. Make a transparency of this
figure and put it on top of the shaded ocean map that follows, and that is
what the eventual figure will look like.
PostScript | JPEG
The following map indicates ocean regions where ships go throughout
the calendar year.
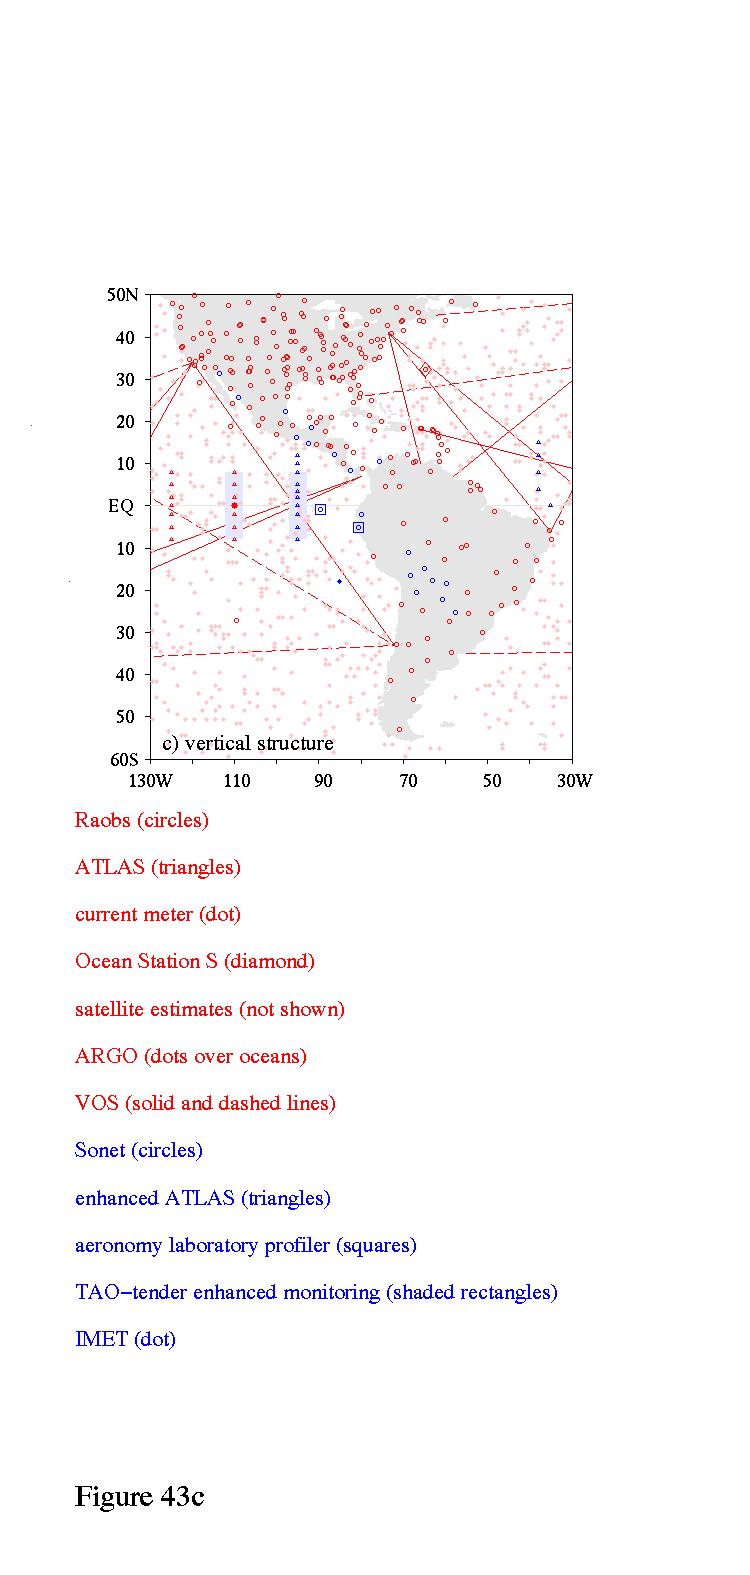
Panel c: vertical structure measurements.
PostScript | JPEG