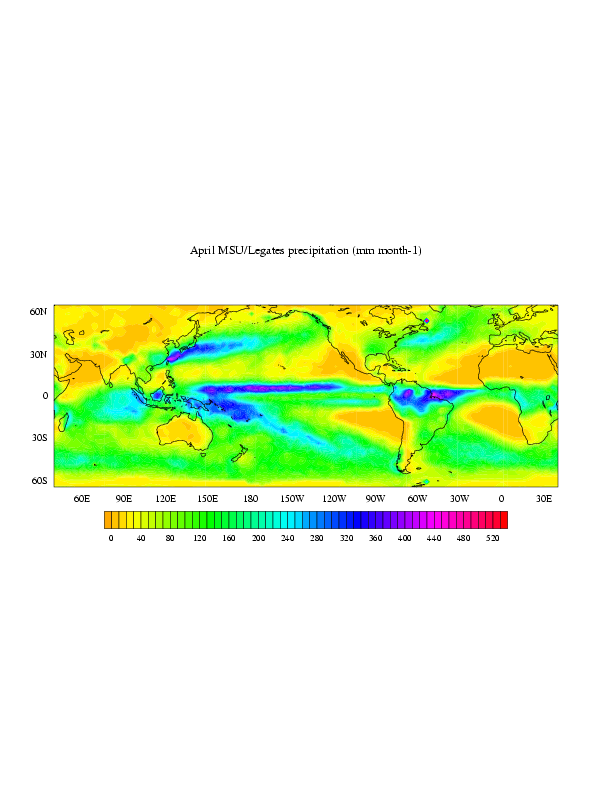
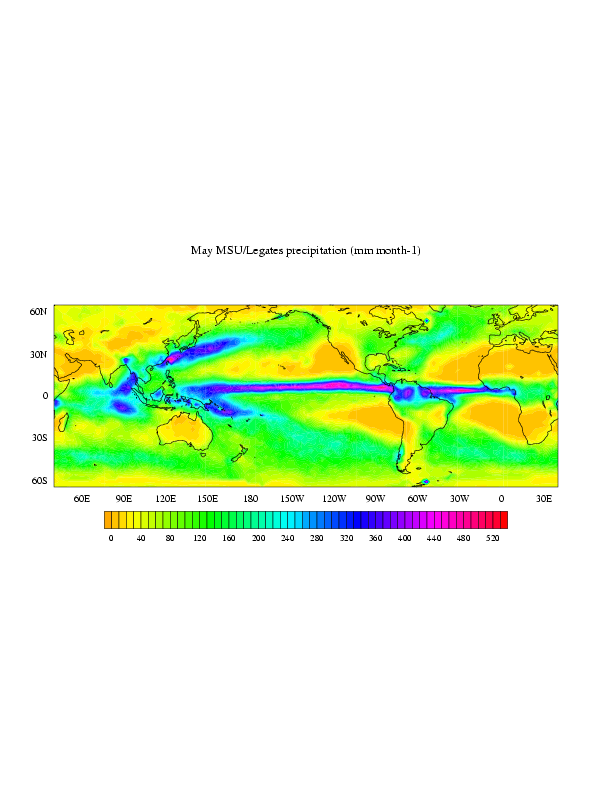
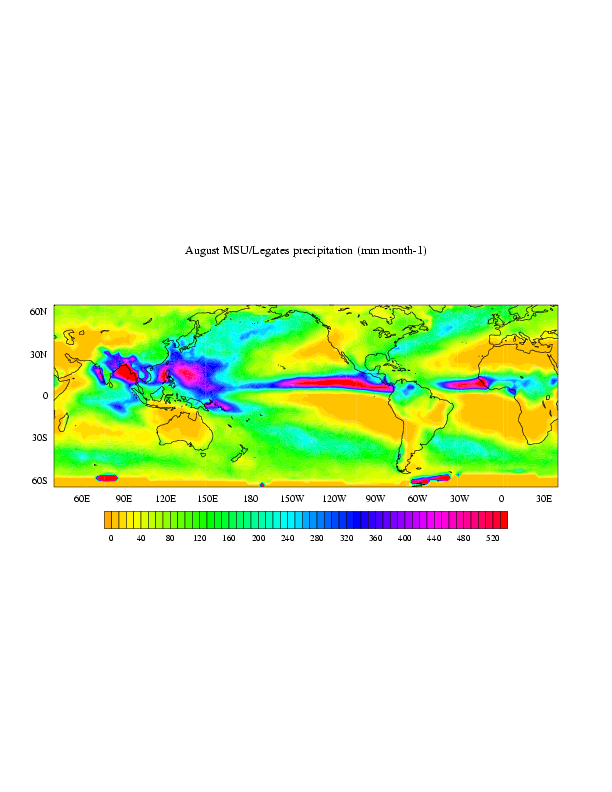
Spencer and collaborators developed a new MSU precipitation product ("Limb90"), and I got part way through merging it with the Legates and Willmott climatology. This work was never satisfactorily finished, but it is linked here. MSU has difficulty differentiating sea ice from very heavy rainfall, and it is pretty difficult to remove the erroneous gridpoints in a simple manner.
References
Data
2) Rain gauge data component.
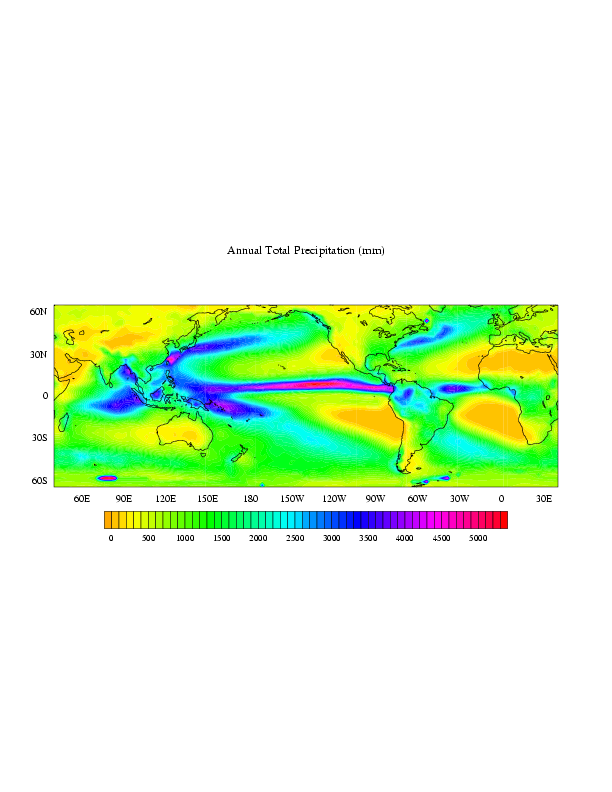
Annual Total (mm): large GIF | PDF | PNG
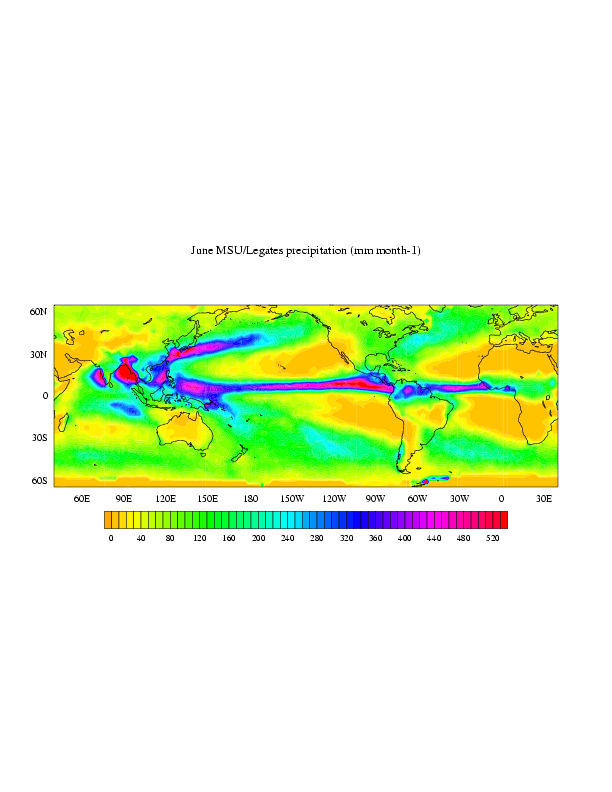
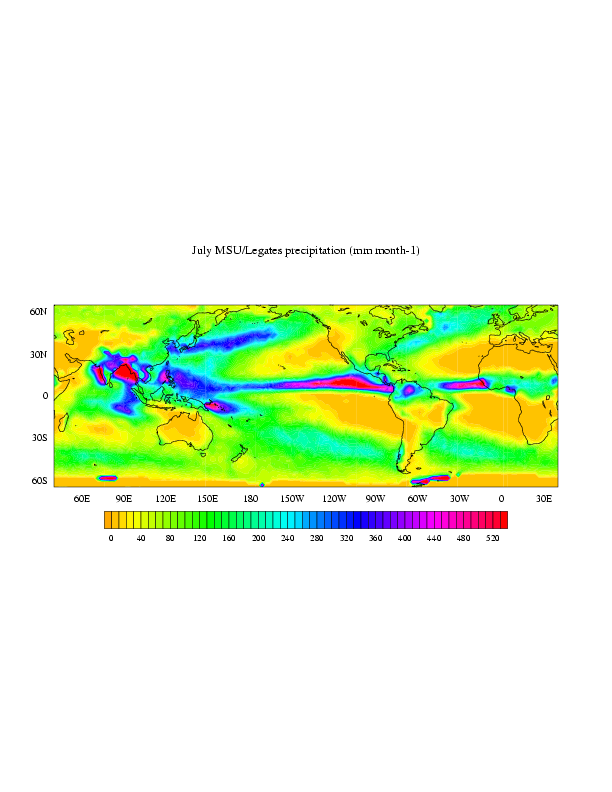
Individual Calendar Months (mm month-1)
A PDF file containing all of the monthly
analyses is linked here.
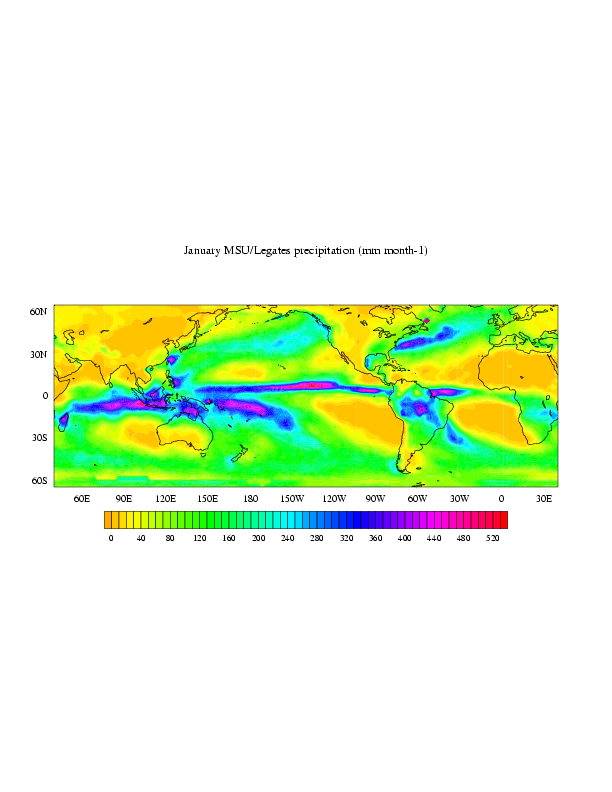
January:
large GIF |
PDF |
PNG
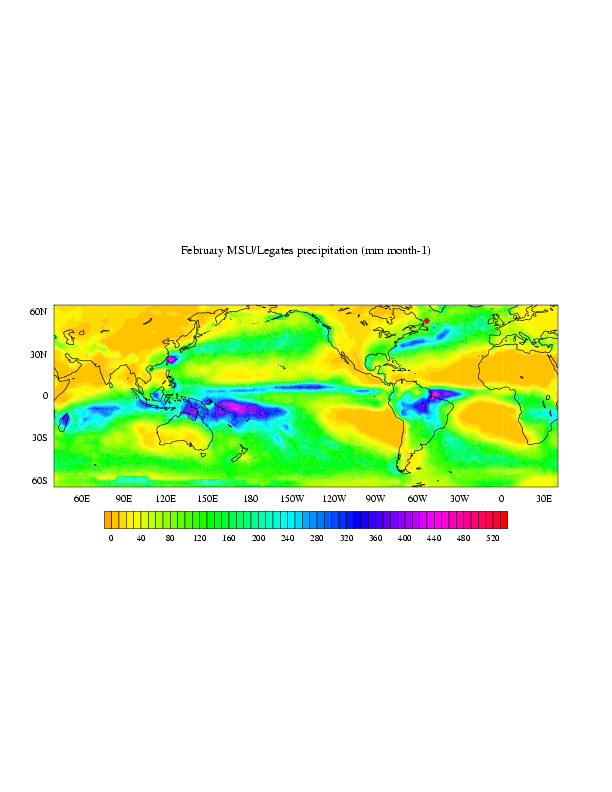
February:
large GIF |
PDF |
PNG
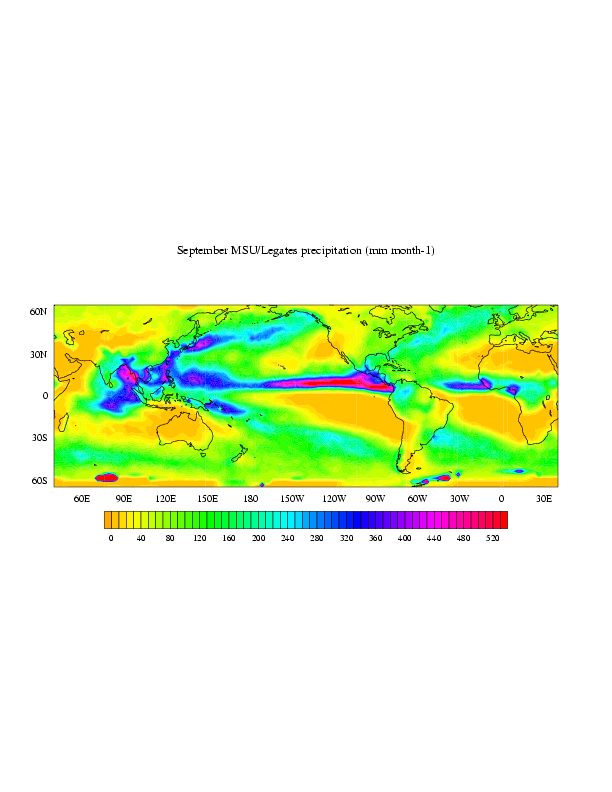
September:
large GIF |
PDF |
PNG
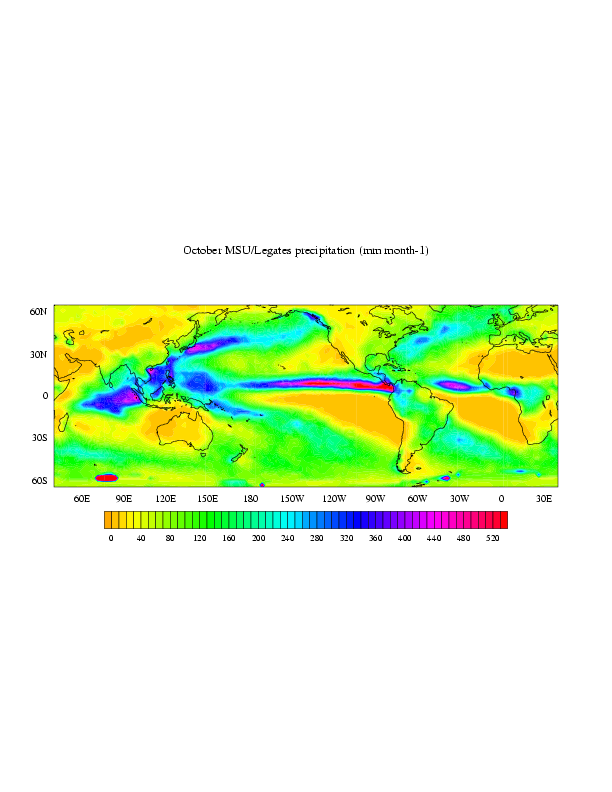
October:
large GIF |
PDF |
PNG
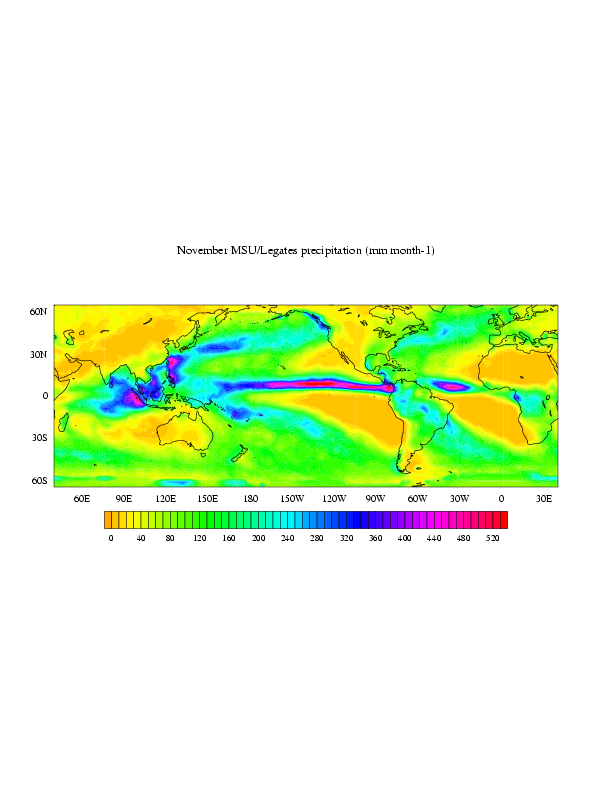
November:
large GIF |
PDF |
PNG
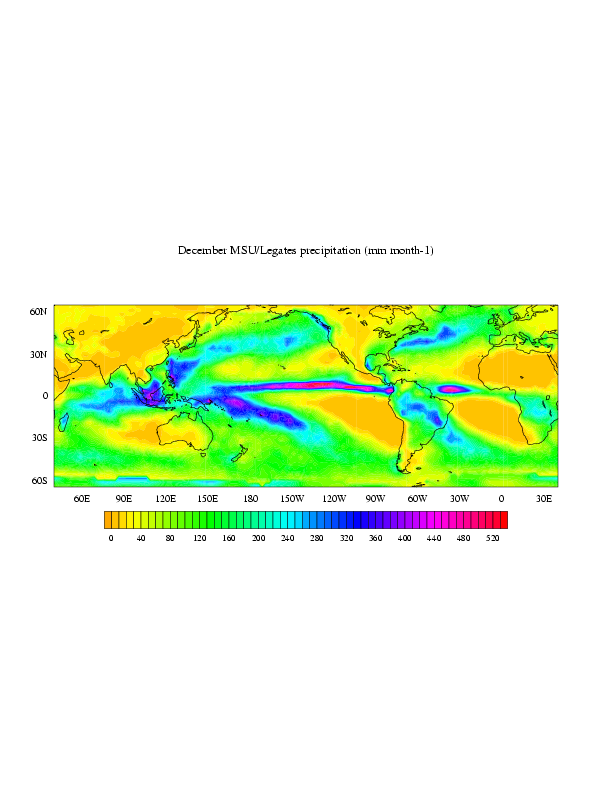
December:
large GIF |
PDF |
PNG
1) Merged data set.
Each map contains complete fields of data (no missing values).
The first grid point of the ASCII versions are centered at
88.75 S, 1.25 E; the second grid point at 88.75 S, 3.75 E;
and so forth. The global data values for January are given first,
then the global data values for February, and so forth. The data was
written in FORTRAN with an 8f8.2 format. A simple FORTRAN code to
read the climatology is linked here.
Analyses
Animations
Monthly mean precipitation over the Pacific and Atlantic (744K)
Monthly mean precipitation over the Indian Ocean (544K)