
Realtime Climate Data
Analyses
Go to: rainfall | temperature | pressure | geopotential height
NOTE: Use your browser's "back" button to return to this page from external links.
Rainfall
- Global
- 60N-60S
- United States
Sea Surface Temperature (SST)
- Nino 1+2, Nino 3, Nino 4 anomaly indices (averaging regions):
- figure: last 12 months, 1990-present; digital values (NCEP)
- "Nino" indice standard deviations: How unusual is a 1C anomaly?
- Weekly tropical Pacific total and anomaly | animation (NCEP)
- Weekly, monthly, and seasonal anomalies | weekly anomaly animation (CDC)
- weekly or shorter means (NESDIS)
- 5-day mean | monthly mean Tropical Pacific mean and anomaly maps (PMEL)
- figure: last 12 months, 1990-present; digital values (NCEP)
Land Surface Temperature
- timeseries for the last 30, 90, and 365 days (NCEP)
- hemispheric- and global-means (Tiempo)
- global means for land only and land + ocean (GISS)
Eq. Pacific Ocean longitude-depth temperature section
- last month (PMEL)
Sea-level Pressure (SLP)
- The Southern Oscillation Index (SOI) is the difference in normalized SLP anomalies for Tahiti and Darwin (Australia) (Tahiti minus Darwin), and it is an indicator of the atmospheric component of the El Niño / Southern Oscillation phenomenon (ENSO). Negative values of the SOI are associated with above normal sea surface temperatures in the equatorial Pacific, and these conditions are commonly called a warm ENSO episode. Positive SOI values are associated with cold Pacific SSTs, and this is called a cold ENSO episode.
- plot and digital values (NCAR)
- map for 50N-50S (NCEP)
500 hPa Geopotential Height Anomalies
Analysis Sources:
- CDC: NOAA Climate Diagnostics Center
- GISS: NASA Goddard Institute for Space Studies
- NCEP: NOAA National Centers for Environmental Prediction Climate Prediction Center
- NWS: National Weather Service
- PMEL: NOAA Pacific Marine Environmental Laboratory
Tiempo
Still more analyses can be found at the
Climate Forecasts
Most of the forecast products are very technical, so non-scientists be warned. Much of the effort in seasonal climate forecasting is expended in forecasting tropical Pacific sea surface temperatures (SSTs), and in particular, how the SSTs in this region vary from one year to the next. These fluctuations are associated with the El Niño / Southern Oscillation phenomenon (ENSO), which the popular press calls El Niño / La Niña.
Global temperature and precipitation forecasts:
- NCEP Climate Prediction Center forecasts (Somewhat technical)
- International Research Institute for Climate and Society (Somewhat technical)
Tropical Pacific SST forecasts:
- NCEP ENSO advisory (Easiest to understand)
- NCEP Climate Diagnostics Bulletin (Scroll down to the forecast forum; somewhat technical.)
- International Research Institute for Climate and Society
- SST maps | Nino3.4 forecasts and model documentation (Technical)
- Linear inverse model (Very technical)
- European Centre for Medium Range Weather Forecasts (ECMWF) seasonal coupled ocean-atmosphere model Nino3 SST anomaly (Very technical)
The standard deviation (C) of "Nino3" and "Nino3.4" SST by calendar month (1950-79):
| Jan | Feb | Mar | Apr | May | June | Jul | Aug | Sep | Oct | Nov | Dec | |
|---|---|---|---|---|---|---|---|---|---|---|---|---|
| Nino3 | 0.93 | 0.68 | 0.44 | 0.53 | 0.63 | 0.67 | 0.75 | 0.85 | 0.87 | 0.89 | 1.03 | 1.08 |
| Nino3.4 | 1.05 | 0.79 | 0.59 | 0.53 | 0.52 | 0.53 | 0.60 | 0.72 | 0.80 | 0.88 | 1.04 | 1.06 |
The standard deviations for other periods>>
Ed Sarachik initiated a very nice WWW page of different forecast products. (This site and the sites it references are without discussion. Scroll down to get to the forecasts. Very technical)
Forecasts of precipitation and air temperatures over land
- International Research Institute for Climate and Society (Much, if not all, of the forecast skill in this forecast is due to the ability to predict ENSO variability.)
Climate Impacts
See also:
Typical ENSO climate impacts
What are the present conditions in the equatorial Pacific?
See latest Pacific Ocean sea surface temperatures (SSTs) and departures from climatology»
The bottom panel indicates regions of above and below normal SST, and conditions on the equator between 180 and 120°W are interpreted in the popular press as "El Niño" (above normal SST, red shading) or "La Niña" (below normal SST, blue shading), respectively. We tend to refer to these variations in the equatorial Pacific SST as warm and cold ENSO episodes, respectively, and we reserve the term "El Niño" to mean the periods of above normal SST along the Peru and Ecuador coast. El Niño and ENSO warm episodes often occur at the same time.
How does the ENSO typically influence the climate in the Pacific Northwest and around the globe?
- Impact on the Pacific Northwest of the United States
- Global Impacts
The following links are in order of increasing technical difficulty:
- Reports to the Nation: El Niño and Climate Prediction
- "El Niño/La Niña, Nature's Vicious Cycle" from National Geographic
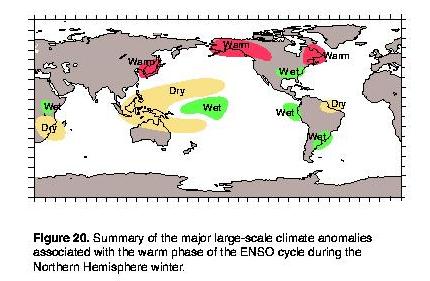
A simple description of the primary impacts of warm ENSO episodes on North American climate is presented next. Changes of the climate in the opposite sense are normally observed during cold ENSO episodes.
December through April:
Changes in the preferred regions of storms produce variations in precipitation and surface temperature in the indicated regions: GIF image | PostScript | JPEG.
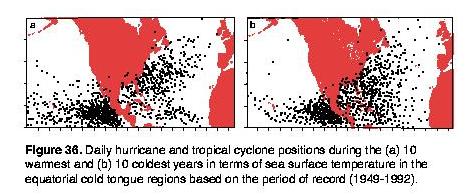
June through November:
Changes in the number of hurricanes and tropical storms in the Gulf of Mexico, Caribbean Sea, and eastern Pacific. More hurricanes and tropical storms are found in the eastern Pacific and fewer in the Gulf of Mexico and Caribbean Sea during ENSO warm episode years, as shown by the daily storm positions in the left panel. ENSO cold episodes, in contrast, are characterized by fewer Pacific and more Gulf of Mexico and Caribbean Sea storms. ENSO does not seem to affect the number of storms in the main Atlantic basin. GIF image | PostScript | JPEG
Typical temperature and precipitation anomalies during warm ENSO and cold ENSO
Still more information on ENSO is available at:
- NOAA Office of Global Programs: a potpourri of monitoring, modelling, and impacts resources
- NOAA Pacific Marine Environmental Laboratory: lots of near real-time graphics of equatorial Pacific Ocean climate
Please report problems or corrections to DATA webmaster: Todd Mitchell <mitchell@atmos.washington.edu>.