| Latitude 48° 11´N |
Longitude 114° 8´W |
Elevation 896 meters |
 COOP Northwest |
 Montana |
Help Main |
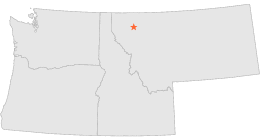
| 5 mi | W : | KALISPELL, MT |
| 5 mi | W : | KALISPELL, MT |
| 6 mi | NNW : | COLUMBIA FALLS 5 SW, MT |
| 6 mi | NNW : | KALISPELL AP, MT |
| 6 mi | NNW : | KALISPELL 9 NNE, MT |
| 8 mi | NNE : | HUNGRY HORSE DAM, MT |
| 10 mi | WSW : | KILA, MT |
| 11 mi | NNW : | WHITEFISH, MT |
| 12 mi | NNW : | WHITEFISH, MT |
| 13 mi | SW : | KILA 9 SSW, MT |