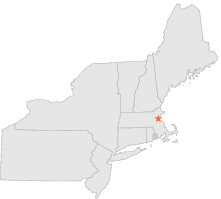
190770 - BOSTON LOGAN INT'L ARPT, Massachusetts

Latitude
42° 22´N
Longitude
71° 1´W
Elevation
6 meters

COOP Northeast

Massachusetts
Help

Main
10 nearest COOP Northeast stations
5 miWNW :CAMBRIDGE, MA
7 miNNW :SPOT POND, MA
7 miWSW :CHESTNUT HILL, MA
7 miNNE :WEST LYNN, MA
9 miNE :SWAMPSCOTT, MA
9 miWNW :ARLINGTON, MA
11 miSSE :HINGHAM, MA
11 miWNW :LEXINGTON, MA
11 miWSW :NEWTON, MA
12 miSSW :MILTON BLUE HILL OBSERVATORY, MA

Weather variables    Help
Click a weather variable name to jump down to those statistics.
Total
observations
%
NDJFM
observations
%
TMAX
18258
100.0%
7558
99.9%
TMIN
18251
99.9%
7557
99.9%
PRCP
18200
99.7%
7558
99.9%
SNOW
17650
96.6%
7377
97.5%


TMAX     Help     top of page

TMAX
observations
mean
std dev
   
Distribution
during extreme days of
NDJFM
7558  by year
42.5°F
11.2°F
   
overall
NAM
PNA
CTI

TMAX and NAM    Help
scatterplot
days
by month
mean
NAM index
extreme high
NAM days
extreme low
NAM days
ratio of extreme
high:low NAM days
Extreme high events
Days with TMAX>=60°F
566
0.33
119
38
3.1*
map
table
Extreme low events
Days with TMAX<=26°F
544
-0.12
103
118
1.1
map
table

TMAX and PNA    Help
scatterplot
days
by month
mean
PNA index
extreme high
PNA days
extreme low
PNA days
ratio of extreme
high:low PNA days
Extreme high events
Days with TMAX>=60°F
566
-0.34
35
105
3.0*
map
table
Extreme low events
Days with TMAX<=26°F
544
0.33
142
75
1.9*
map
table

TMAX and CTI    Help
days
by month
high CTI days
(moderate to strong
El Niño winters)
low CTI days
(moderate to strong
La Niña winters)
ratio of high:low CTI
(El Niño:La Niña days)
Extreme high events
Days with TMAX>=60°F
566
96
106
1.1
map
table
Extreme low events
Days with TMAX<=26°F
544
65
80
1.2
map
table

TMAX under 2 index extremes     Help
Station table Maps - choose one extreme:
High NAMLow NAM High PNALow PNA High CTILow CTI


TMIN     Help     top of page

TMIN
observations
mean
std dev
   
Distribution
during extreme days of
NDJFM
7557  by year
28.4°F
10.6°F
   
overall
NAM
PNA
CTI

TMIN and NAM    Help
scatterplot
days
by month
mean
NAM index
extreme high
NAM days
extreme low
NAM days
ratio of extreme
high:low NAM days
Extreme low events
Days with TMIN<=11°F
526
-0.05
107
113
1.1
map
table
Extreme high events
Days with TMIN>=43°F
581
0.15
90
51
1.8*
map
table

TMIN and PNA    Help
scatterplot
days
by month
mean
PNA index
extreme high
PNA days
extreme low
PNA days
ratio of extreme
high:low PNA days
Extreme low events
Days with TMIN<=11°F
526
0.34
141
71
2.0*
map
table
Extreme high events
Days with TMIN>=43°F
581
-0.17
47
89
1.9*
map
table

TMIN and CTI    Help
days
by month
high CTI days
(moderate to strong
El Niño winters)
low CTI days
(moderate to strong
La Niña winters)
ratio of high:low CTI
(El Niño:La Niña days)
Extreme low events
Days with TMIN<=11°F
526
63
70
1.1
map
table
Extreme high events
Days with TMIN>=43°F
581
99
95
1.0
map
table

TMIN under 2 index extremes     Help
Station table Maps - choose one extreme:
High NAMLow NAM High PNALow PNA High CTILow CTI


PRCP (total liquid water equivalent)     Help     top of page

PRCP
observations
mean
   
Distribution
during extreme days of
NDJFM
7558  by year
0.13"
   
overall
NAM
PNA
CTI

PRCP and NAM    Help
scatterplot
days
by month
mean
mean
NAM index
extreme high
NAM days
extreme low
NAM days
ratio of extreme
high:low NAM days
Observed events
Days with PRCP>0.00"
2857
0.35"
-0.00
446
468
1.0
map
table
Extreme events
Days with PRCP>0.59"
563
1.11"
-0.04
82
96
1.2
map
table

PRCP and PNA    Help
scatterplot
days
by month
mean
mean
PNA index
extreme high
PNA days
extreme low
PNA days
ratio of extreme
high:low PNA days
Observed events
Days with PRCP>0.00"
2857
0.35"
-0.02
485
500
1.0
map
table
Extreme events
Days with PRCP>0.59"
563
1.11"
0.37
145
63
2.3*
map
table

PRCP and CTI    Help
days
by month
mean
high CTI days
(moderate to strong
El Niño winters)
low CTI days
(moderate to strong
La Niña winters)
ratio of high:low CTI
(El Niño:La Niña days)
Observed events
Days with PRCP>0.00"
2857
0.35"
458
478
1.0
map
table
Extreme events
Days with PRCP>0.59"
563
1.11"
108
88
1.2
map
table

PRCP under 2 index extremes     Help
Station table Maps - choose one extreme:
High NAMLow NAM High PNALow PNA High CTILow CTI


SNOW     Help     top of page

SNOW
observations
mean
   
Distribution
during extreme days of
NDJFM
7377  by year
0.28"
   
overall
NAM
PNA
CTI

SNOW and NAM    Help
scatterplot
days
by month
mean
mean
NAM index
extreme high
NAM days
extreme low
NAM days
ratio of extreme
high:low NAM days
Observed events
Days with SNOW>0.0"
1158
1.79"
-0.11
187
238
1.3*
map
table
Extreme events
Days with SNOW>2.9"
226
5.83"
-0.03
34
42
1.2
map
table

SNOW and PNA    Help
scatterplot
days
by month
mean
mean
PNA index
extreme high
PNA days
extreme low
PNA days
ratio of extreme
high:low PNA days
Observed events
Days with SNOW>0.0"
1158
1.79"
0.07
236
215
1.1
map
table
Extreme events
Days with SNOW>2.9"
226
5.83"
0.26
55
37
1.5
map
table

SNOW and CTI    Help
days
by month
mean
high CTI days
(moderate to strong
El Niño winters)
low CTI days
(moderate to strong
La Niña winters)
ratio of high:low CTI
(El Niño:La Niña days)
Observed events
Days with SNOW>0.0"
1158
1.79"
168
189
1.1
map
table
Extreme events
Days with SNOW>2.9"
226
5.83"
25
31
1.2
map
table

SNOW under 2 index extremes     Help
Station table Maps - choose one extreme:
High NAMLow NAM High PNALow PNA High CTILow CTI