| Latitude 39° 56´N |
Longitude 91° 12´W |
Elevation 233 meters |
 COOP Midwest |
 Illinois |
Help Main |
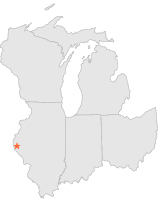
| 8 mi | SSW : | PAYSON, IL |
| 11 mi | W : | QUINCY, IL |
| 11 mi | W : | QUINCY MEMORIAL BRIDGE, IL |
| 13 mi | W : | QUINCY DAM 21, IL |
| 15 mi | NE : | GOLDEN, IL |
| 19 mi | SSE : | BARRY WATERWORKS, IL |
| 22 mi | ESE : | PERRY 6 NW, IL |
| 24 mi | E : | MOUNT STERLING, IL |
| 25 mi | NNE : | AUGUSTA, IL |
| 29 mi | ESE : | GRIGGSVILLE, IL |