
- Data »
- Climate Data Archive
Climate Data Archive
This data archive is slowly being migrated to the Center for Science in the Earth System (CSES). A good way to find a data set on this and the CSES pages is to google "jisao keyword," where keyword could be SST, or the name of a particular data set.
NOTE: All links to external websites will open in a new window. Close these windows when you are finished with the resource.
The data archive consists of
- Gridded data sets: document spatial and temporal variability
- Key climate time series: North Atlantic Oscillation, northeast Brazil rainfall, etc.
- Links to WWW data sites: a good starting place for data sets that we don't provide
- Links to WWW sites which provide software to analyze data.
Gridded Data Sets
Go to: precipitation | surface temperature | sea-level pressure | surface vector wind & stress | miscellaneous
The gridded data sets are written in network common data form (netCDF) conforming to the Cooperative Ocean-Atmosphere Research Data Service (COARDS) standard. ( Description of COARDS netCDF standard.) A superset of the COARDS standard, called the NetCDF climate and forecast (CF) metadata convention, includes the possibility to store time series for multiple stations, along with their names and coordinates.
- MATLAB scripts for reading and writing data in netCDF.
- MATLAB scripts for reading FITS-format files.
- MATLAB distributed oceanographic data system (DODS) code for reading files at other institutions.
- MATLAB code for reading data written in hierarchical data format (HDF).
- NOAA ESRL provides both FORTRAN and IDL routines to read netCDF files.
- netCDF (command line) operators (NCOs) to manipulate netCDF and HDF files
- ASCII dumps of netCDF files (how to read them).
- GrADS command lines for reading a netCDF file.
GrADS users:The older files were written with time specified as yyyymmddhhmmss (year, month, ...), and GrADS does not recognize this time convention. If you run into a file like this, please let me know, and I will update the time specification in the file
If you need the data in ASCII format, let me know, and time permitting, I will see what I can do.
Precipitation
| Name | Temporal Resolution |
Spatial Resolution |
Range of Years | Comments |
|---|---|---|---|---|
| Rain gauge: DoE (Eischeid et al.) NCDC GHCN NASA GISS University of East Anglia GPCC GPCP University of Delaware University of Washington NCEP CPC |
seasonal monthly monthly monthly monthly monthly monthly daily daily, monthly |
4x5° 5° 2.5° 2.5x3.75° 2.5, 1° 2.5° 0.5, 1.0° "50" km 0.25, 1° |
1851-1989 1900-present 1850-1996 1900-98 1986-98 1979-Jan2005 1900-2008 1949-94 1948-98 |
anomalies anomalies anomalies totals & climatology totals & climatology totals totals & climatology Pacific Northwest Pacific Northwest/US |
| Satellite, gauge, model: CMAP monthly CMAP pentad |
monthly pentad |
2.5° 2.5° |
1979-Sep2004 1979-Mar2009 |
|
| Satellite & gauge: Legates/MSU CAMS-OPI GPCP monthly GPCP pentad GPCP daily CMAP monthly CMAP pentad |
monthly monthly monthly pentad daily monthly pentad |
2.5° 2.5° 2.5° 2.5, 1° 1° 2.5° 2.5° |
climatology 1979-Jan 2009 1979-2010 1979-Apr 2008 1996-Apr 2009 1979-Sep 2004 1979-Mar2009 |
|
| Satellite: MSU GPI SSM/I (NESDIS) SSM/I (RSS) OLR |
monthly monthly/pentad/daily monthly monthly monthly |
2.5° 2.5° 2.5° 0.25, 0.5° 2.5° |
1979-July1997 1987-May1996 1987-Oct1996 1987-July2002 1974-Nov1998 |
oceans only totals & climatology |
Surface Temperature
| Name | Temporal Resolution |
Spatial Resolution |
Range of Years | Comments |
|---|---|---|---|---|
| Land only: University of East Anglia University of Delaware NCDC GHCN |
monthly monthly monthly |
5° 0.5, 1.0° 5° |
1850-present 1900-2008 1880-present |
sampling totals anomalies |
| Land and ocean: UEA / UKMO NOAA (ERSST and GHCN) NASA GISS Legates and Willmott climatology IABP / POLES merged Arctic |
monthly monthly monthly monthly monthly monthly |
5° 5° 2.5° 0.5, 2.5° other, 1° 1° |
1850-present 1880-present 1979-97 1979-present 1950-99 |
sampling Arctic |
| sea surface temp. (SST): LDEO Extended reconstructed NCEP EOF-filtered NCEP optimal interpolation Merged NCEP EOF / OI Sadler climatology COADS climatology |
monthly monthly monthly monthly,weekly monthly monthly monthly |
5° 2° 2° 1° 2° 2° 1, 2° |
1856-1991 1854-present 1950-2000 Nov1981-present 1950-May99 |
anomalies tropics |
| ICOADS SST & air temp. |
monthly | 4x6° | 1800-present | anomalies |
Sea-Level Pressure (SLP)
| Name | Temporal Resolution |
Spatial Resolution |
Range of Years | Comments |
|---|---|---|---|---|
| NCAR (Trenberth and Paolino) Reduced resolution COADS Sadler (COADS) climatology COADS climatology LDEO |
monthly monthly monthly monthly monthly |
5° 4x6° 2° 2° 4° |
1899-Apr2009 1800-Feb2006 Apr1854-1992 |
90-12.5N anomalies tropics only global |
| selected NCEP / NCAR reanalysis fields | pentads monthly |
2.5° 2.5° |
1948-2002 1950-79 climatology |
|
Surface or 10-m Vector Wind & Surface Vector Stress
| Name | Temporal Resolution |
Spatial Resolution |
Range of Years | Comments |
|---|---|---|---|---|
| COADS Vector Sfc. Wind |
monthly | 2° | climatology |
global, marine |
| Reduced resolution
COADS vector sfc. wind anomalies |
monthly | 4x6° | 1800-Feb2006 | |
| Sadler Vector Sfc. Wind |
monthly | 2° | climatology |
tropical, marine |
| Sadler Vector Sfc. Stress |
monthly | 2° | climatology |
tropical, marine |
| ERS-1 10-m Vector Wind |
monthly | 1° | 1992-95 |
|
| SSM/I (RSS) 10-m wind speed |
monthly | 0.25, 0.5° | 1987 - July 2002 |
|
Miscellaneous
| Name | Temporal Resolution |
Spatial Resolution |
Range of Years | Comments |
|---|---|---|---|---|
| oceanic low-clouds | seasonal | 2.5° | climatology | |
| COADS cloudiness | monthly | 2° | climatology | global, marine |
| Reduced resolution COADS cloudiness anomalies | monthly | 4x6° | 1800-Feb2006 | |
| Outgoing Longwave Radiation (OLR) | monthly | 2.5° | 1974-Nov98 | |
| Planetary albedo | monthly | 2° | climatology | |
| MSU stratosphere and troposphere temperatures | monthly | 2.5° | 1979-April 2003 | anomalies |
| Elevation data sets (land and sea) | various° | global | ||
| Tropical cyclone positions and number | daily | historical | global | |
| NOAA percentage sea ice | monthly,weekly | 1° | November1981-Feb2005 | version 2 |
| selected NCEP / NCAR reanalysis fields | pentads monthly |
2.5° 2.5° |
1948-2002 1950-79 climatology |
|
| SSM/I (RSS) water vapor and cloud water | monthly | 0.25, 0.5° | 1987 - July 2002 | |
| Land vegetation (NDVI) | monthly | 1° | 1981-2001 | |
| SeaWiFS marine chlorophyll and aerosol | monthly, pentad | 0.5,1,2.5° | 1997-2002 | |
| UW Variable Infiltration Capacity (VIC) hydrological model data | monthly, daily, 3-hourly | 1/8° | 1950-July2000 | |
Key Climate Time Series
Go to: precipitation | surface temperature | sea-level pressure | surface wind | miscellaneous
Precipitation
| Name | Range of Years | Comments |
|---|---|---|
| Global EOFs | 1900-88 | |
| Tropical Pacific and non-Pacific indices from gauge data | 1892-1996, 1850-96 | |
| South America northeast Brazil Piura Perú rainfall and river runoff |
1849-2002 1932-97, 1925-96 |
|
| Africa Sahel, Soudan, Guinea Coast (Nicholson) Sahel (Univ. Washington) Gulf of Guinea (Univ. Washington) |
1901-94 1901-2016 1899-June2001 |
|
All-India
(What is presumably is the same data is offered in easy-to-ingest formats at the COLA: Paolino | monsoondata.org.) Parthasarathy et al. Sontakke et al.
What is presumably is the same data is offered in easy-to-ingest formats by the COLA (Paolino | monsoondata.org) and the IRI |
1871-2001 1870-1997 1844-1992 1871-2001 |
|
| Puget Sound Lowland (Washington State) | 1931-2009 | |
| Northeastern Washington State | 1931-96 | |
| Digital values for numerous stations (WMSSC) | climatology | |
| Walker and Bliss Southern Oscillation index | 1875-1933 | |
Surface Temperature
Sea-Level Pressure (SLP)
| Name | Range of Years | Comments |
|---|---|---|
| Jakarta Indonesia | 1841-1999 | |
| Darwin Australia (UEA, NCEP, NCAR) | 1866-present | |
| Tahiti (UEA, NCEP, NCAR) | 1855-present | |
| Southern Oscillation Index (SOI) NCAR University of East Anglia ICOADS-based Walker and Bliss |
1882-present 1854-present 1800-present 1875-1933 |
|
| North Atlantic Oscillation
(NAO) Hurrell University of East Anglia NCEP |
1864-present 1821-present 1950-present |
obs. & forecast |
| Northern Annular Mode (NAM) / Arctic Oscillation (AO) Colorado State University University of Washington NCEP |
1899-2002 1948-Mar2010 1950-2003 |
obs. & forecast |
| Southern Annular Mode (SAM) / Antarctic Oscillation (AAO) University of Washington · 850 hPa Z · SLP NCEP British Antarctic Survey (Marshall) |
1948-2002 1948-May2011 1979-present 1957-present | obs. & forecast |
Surface Wind
| Name | Range of Years | Comments |
|---|---|---|
| Eq. Pacific zonal wind | 1850-Jun2005 | |
| Eq. Pacific meridional wind | 1850-Jun2005 | |
Miscellaneous
| Name | Range of Years | Comments |
|---|---|---|
| Quasi-Biennial Oscillation (QBO) index | 1953 - present | Freie Universität Berlin |
| Walker and Bliss Southern Oscillation index Quinn et al. El Niño index |
1875-1933 1525-1987 |
|
| Pacific/North American (PNA) pattern index Wallace and Gutzler (1981) grid-point definition EOF-definition |
1948-Oct2010 1948-Mar2010 |
|
| Madden and Julian Oscillation (MJO) | 1979 to mid-2002 | |
| Tropical cyclone positions and number | 1886 - present | |
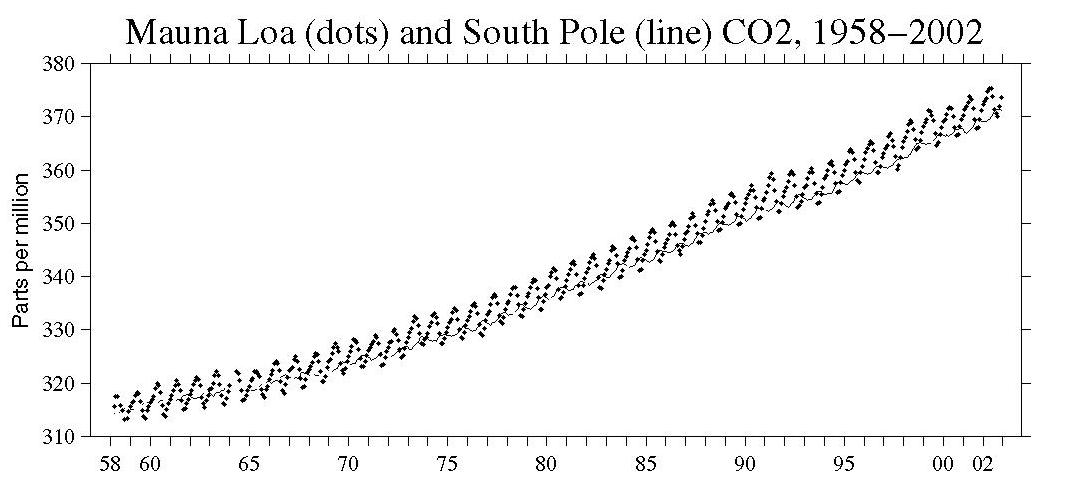
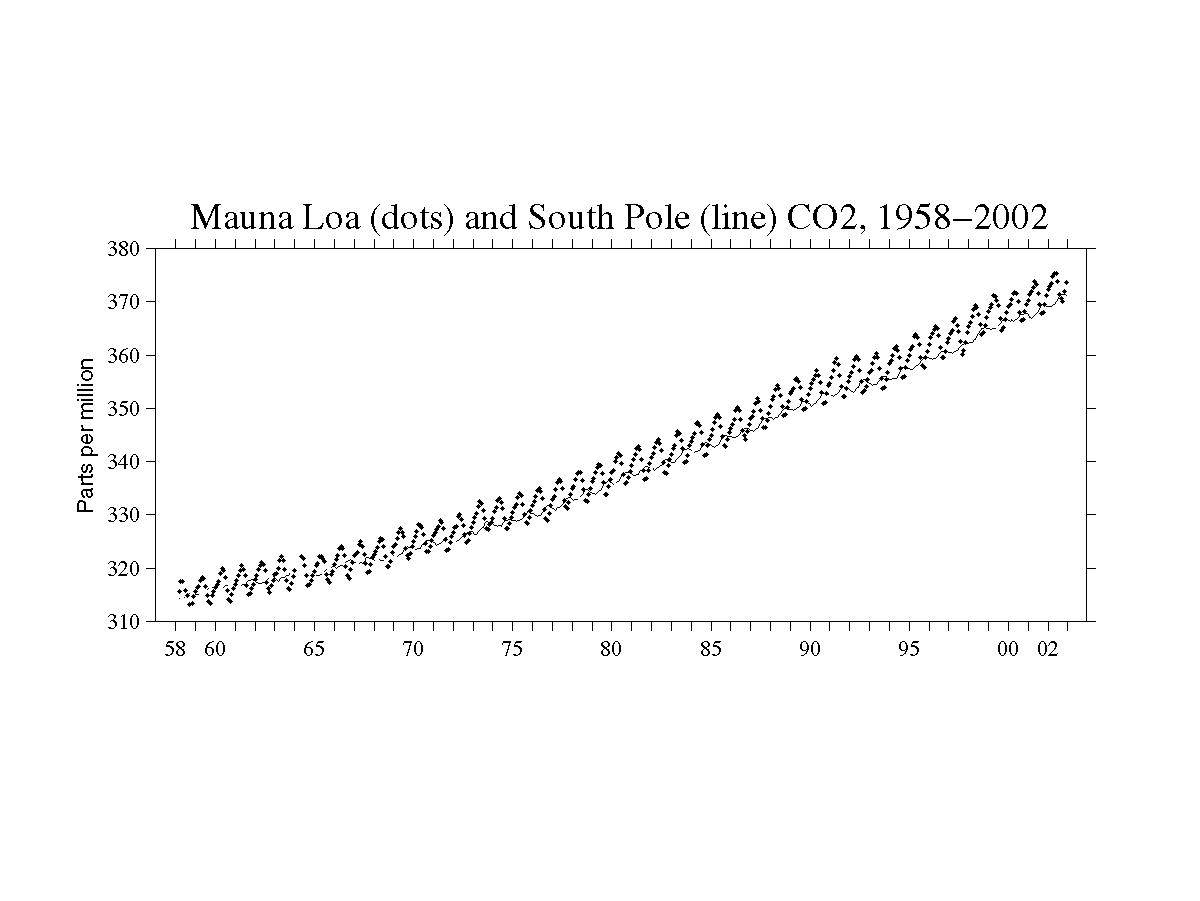
| CO2 station records (Mauna Loa, South Pole, ...) | 1958-2001 | PS JPEG PNG GIF |
| Northern and Southern Hemisphere sea ice extent | 1978 - present | |
Useful WWW Data Sites
Go to: Monthly-means | pentad-means | daily- and hourly means | other
Monthly-means:
Indian Monsoon data: vegetation and precipitation departures served by the Center for Ocean-Land-Atmosphere Studies (COLA)
NOAA National Climatic Data Center
Selected fields from the Japan Meteorological Agency
"WaterWeb" search engine for hydrological data. Let me know if this is useful!
The British Atmospheric Data Centre (BADC) provides global, gridded, historical data sets of sea surface temperatures, sea-level pressure, marine air temperature (nighttime) for academic use.
NASA Goddard Institute for Space Studies (GISS) provides several global, gridded data sets: surface temperature, precipitation, clouds, aerosols, and other fields.
The IRI/LDEO (International Research Institute for Climate Prediction / Lamont-Doherty Earth Observatory) data library contains a broad selection of climate data sets.
Pacific Island Rainfall provided by the Oklahoma Climatological Survey.
University of East Anglia Climatic Research Unit: historical, gridded, global precipitation, SLP, surface temperature, minimum-, maximum-temperature, vapor pressure, and many other fields.
Western Region Climate Center: digital values of climatological mean precipitation and surface temperature for the National Weather Service cooperative network stations in the western United States.
NCEP Climate Prediction Center:
- El Nino / Southern Oscillation (ENSO) and general atmospheric circulation indices
- reanalysis, precipitation, OLR fields
NASA Jet Propulsion Laboratory provides high spatial resolution sea surface temperatures and other, more oceanographic, fields.
The National Center for Atmospheric Research Computational and Information Systems Laboratory Research Data Archive and Informed Guide to Climate Data Sets.
NOAA Climate Diagnostics Center: the NMC Reanalysis data and the Comprehensive Ocean-Atmosphere Data Set (COADS) in netCDF format. Also, water vapor temperature is available here.
Carbon Dioxide Information Analysis Center: historical data sets.
FSU Center for Ocean-Atmospheric Prediction Studies: near real-time monthly-mean pseudostress analyses for the tropical Pacific and Indian Oceans.
Global River Discharge Database Project (RivDIS)
Global
Runoff Data Centre (GRDC) river discharge data.
Pentad-means:
- NOAA National Centers for Environmental Prediction: reanalysis, precipitation, OLR fields
Daily- or hourly means:
- Indian Monsoon data: meteorological fields and precipitation served by the Center for Ocean-Land-Atmosphere Studies (COLA)
- Pacific Island Rainfall provided by the Oklahoma Climatological Survey (PACRAIN).
- PMEL TAO Project hourly and daily data from moorings in the equatorial Pacific Ocean.
- National Climatic Data Center: daily, hourly, and 15-minute averages. mostly U.S., but some global.
- NASA Jet Propulsion Laboratory provides high spatial resolution sea surface temperatures and other, more oceanographic, fields.
- Western Region Climate Center: digital values of climatological mean precipitation and surface temperature for the National Weather Service cooperative network stations in the western United States.
Other sites
Software for analyzing data
Please send me URLs for sites with useful free software for analyzing data.
- "Matlab Tools for Oceanographic Analysis" provided by the Woods Hole Oceanographic Institution and the U.S. Geological Survey
- "Pyclimate" performs SVD, EOFs, filtering, ... using the Python programming language.
- NOAA ESRL provides both FORTRAN and IDL routines to read netCDF files.
- NCAR NCL manipulates netCDF, HDF, and GRIB format files.
* Contact: Todd Mitchell | 206-685-3786 | mitchell@atmos.washington.edu
Please report problems or corrections to DATA webmaster: Todd Mitchell <mitchell@atmos.washington.edu>.